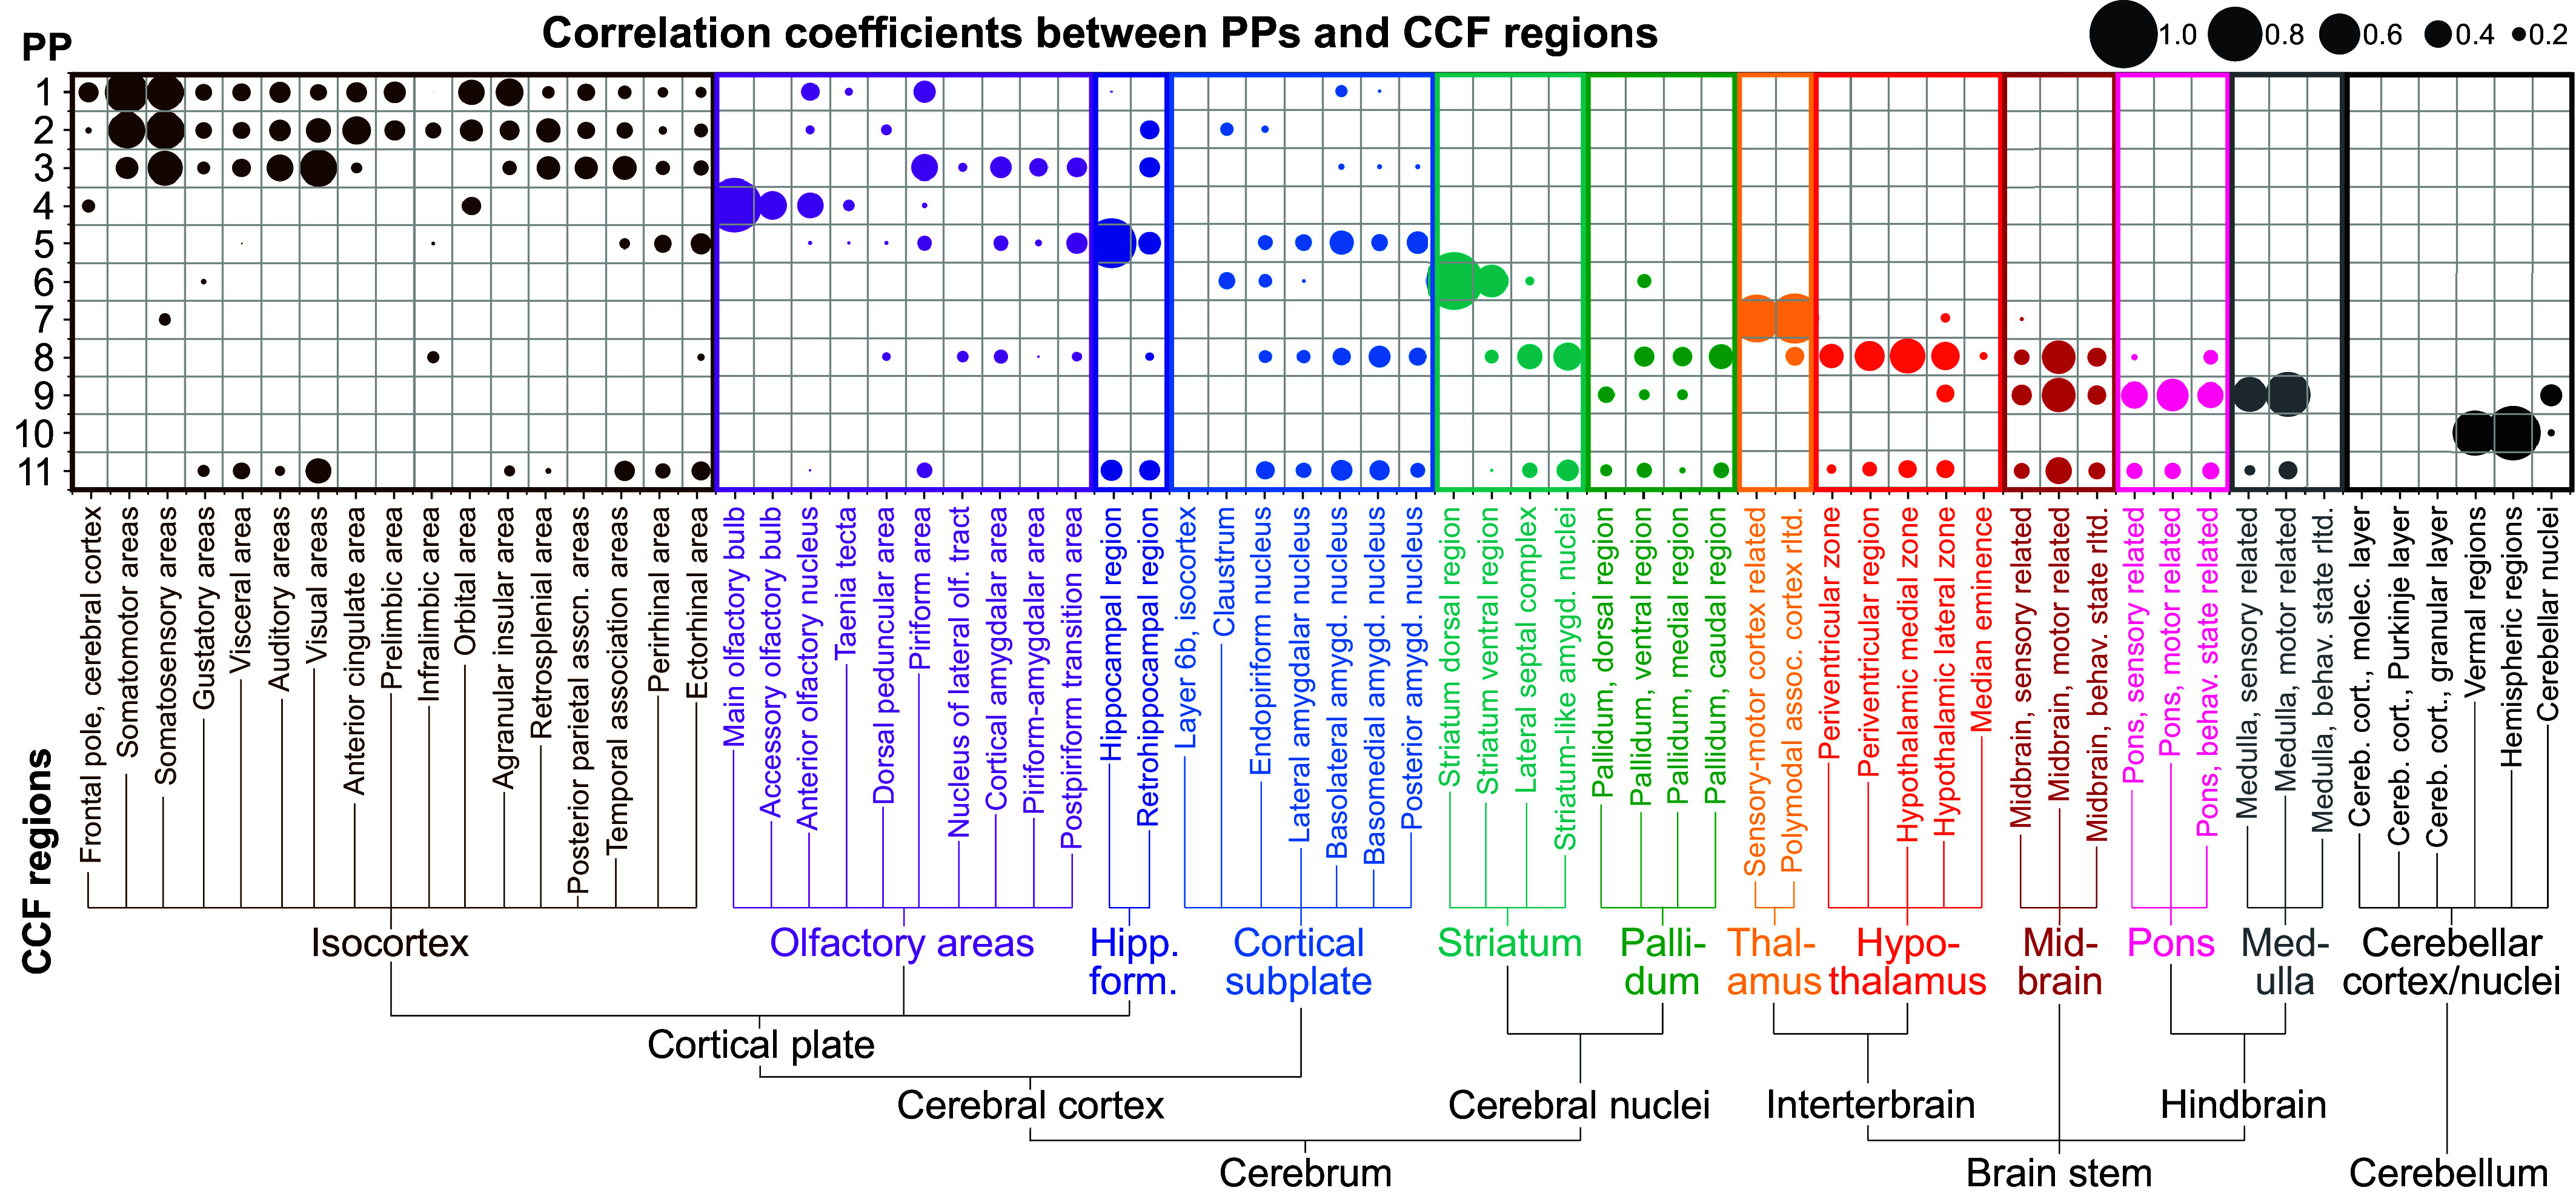
Fig. 2.

Region-dependent correlation between staNMF PPs and the CCF. Bubble plot of the Pearson correlation between PPs (y-axis) and expert-annotated regions from the CCF in the adult mouse brain (x-axis). The bubble size represents the value of the correlation coefficient between each PP and a CCF region. The CCF regions with labels are the complete set of 66 children of the 12 coarse CCF regions and are organized left-to-right based on the CCF ontology map. The PPs are organized top to bottom based on their Pearson correlation to the CCF coarse regions.
