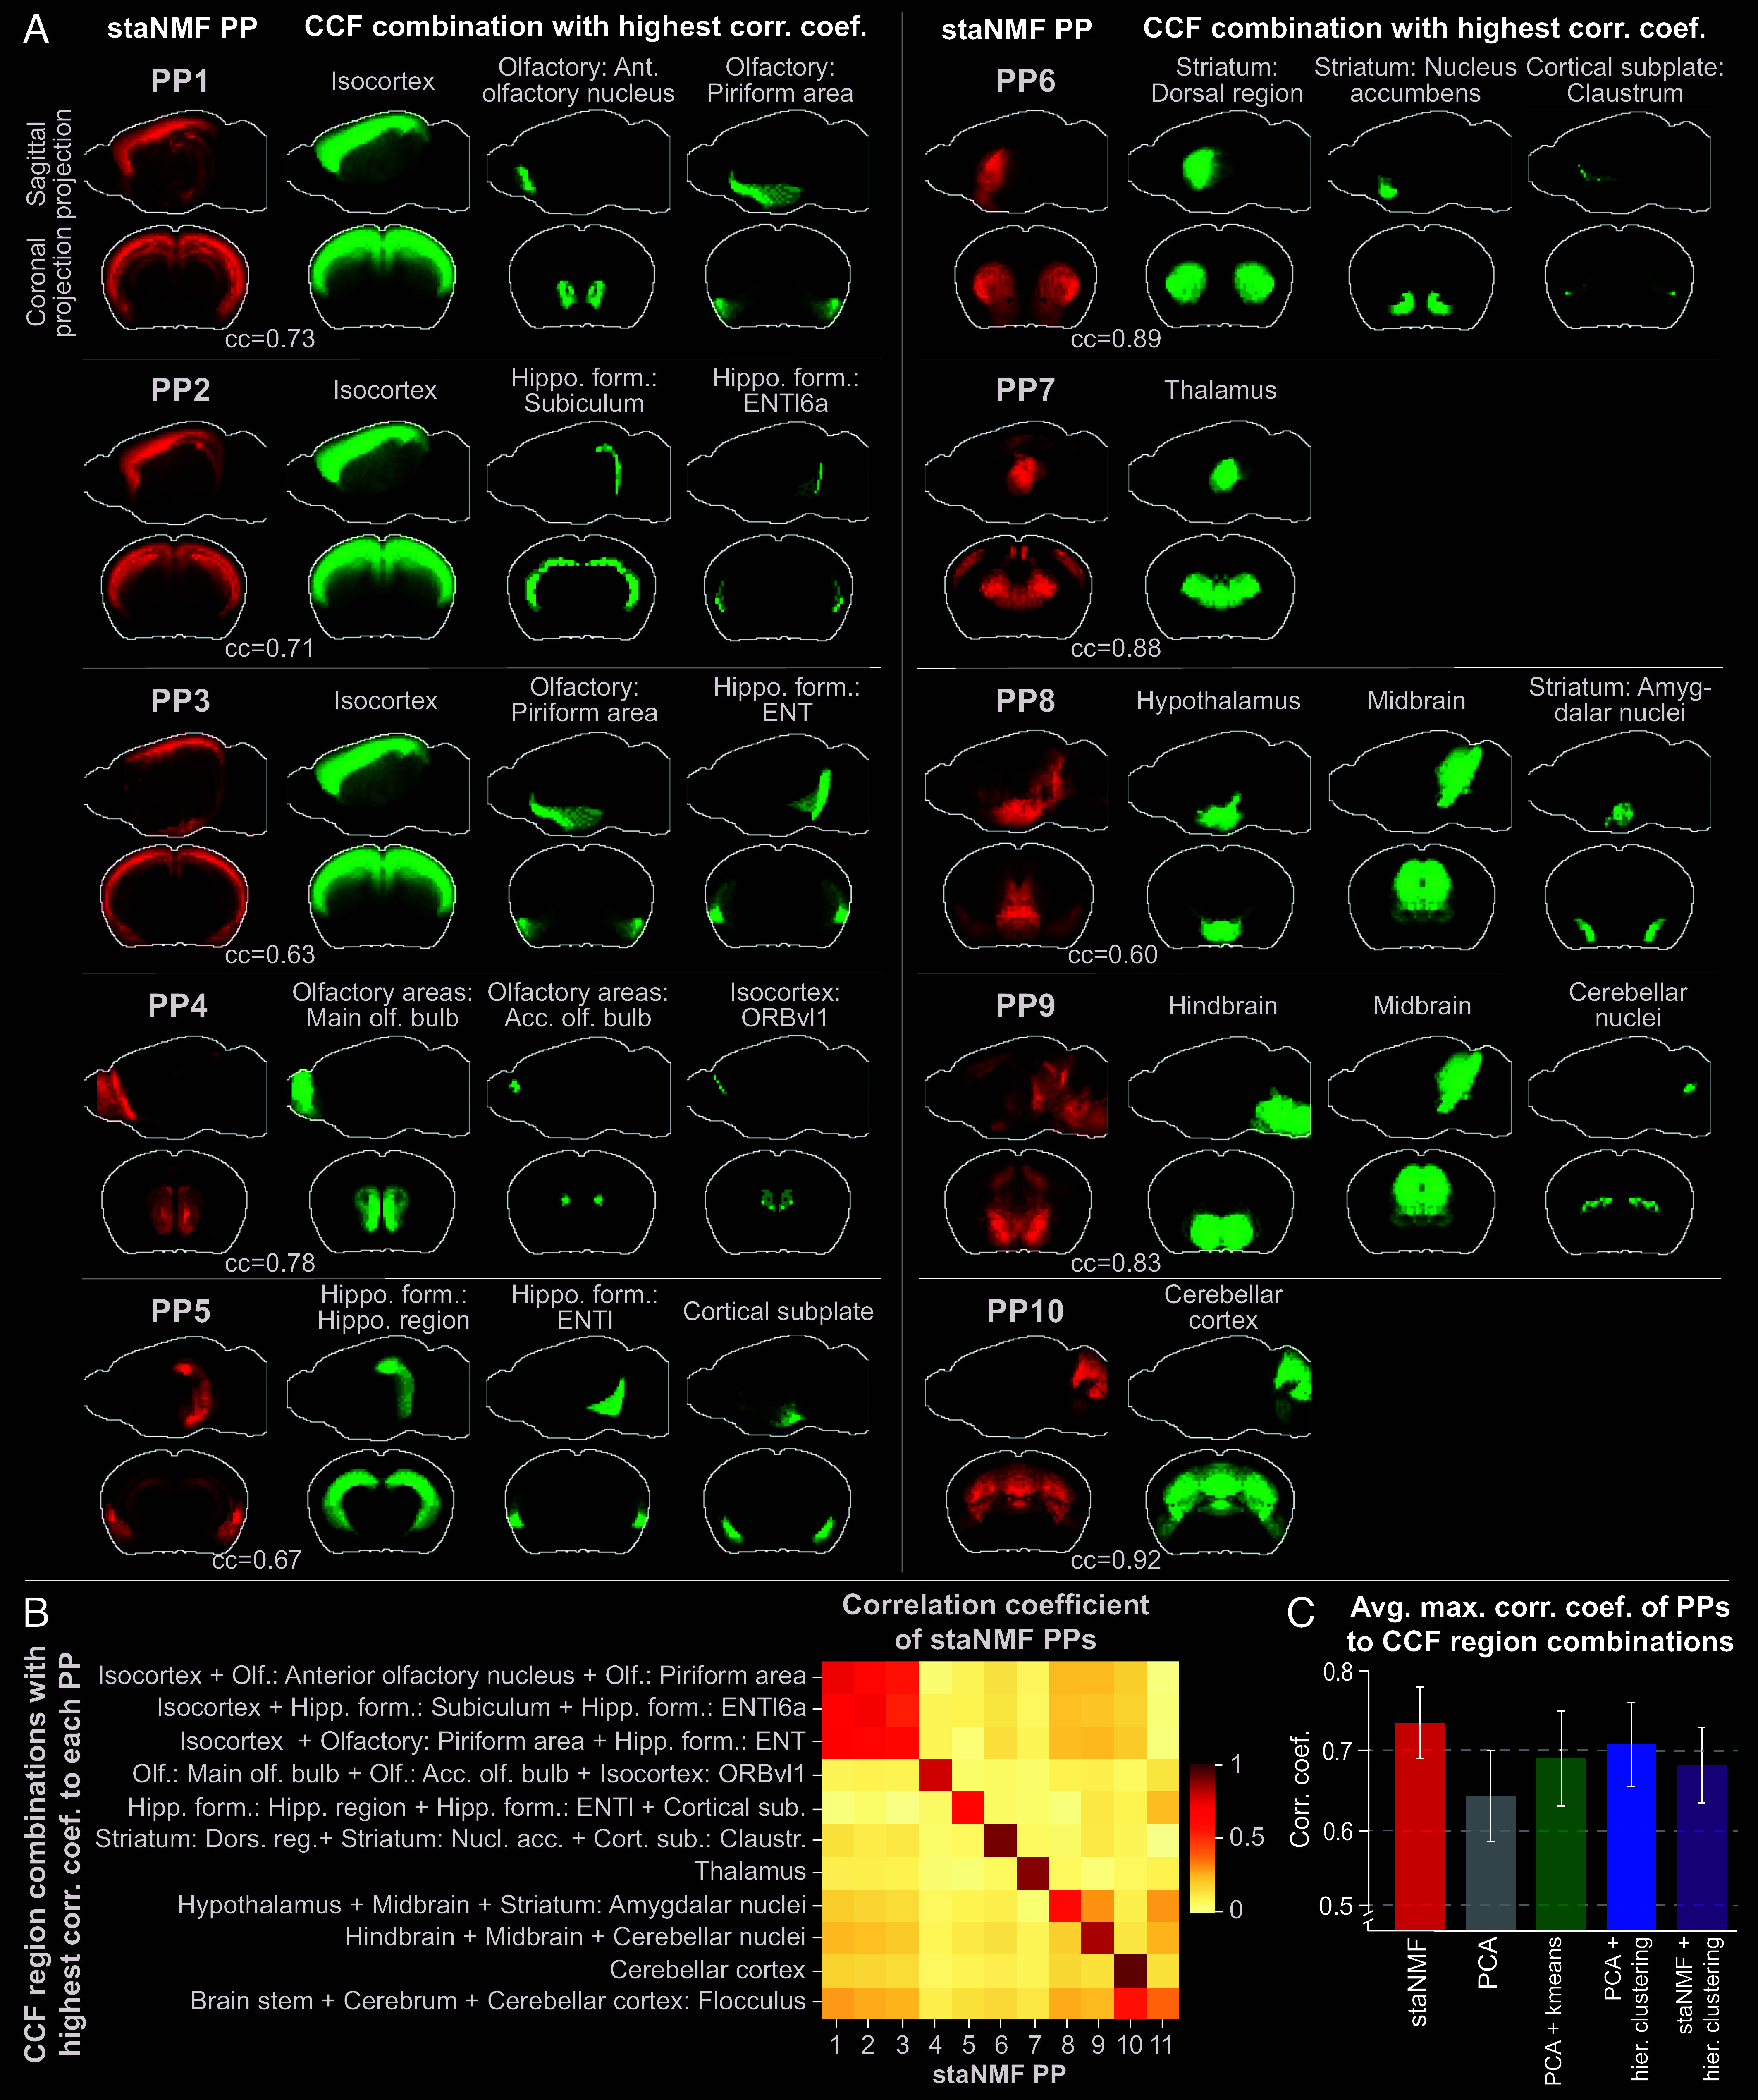
Fig. 3.

Alignment between staNMF PPs and combinations of CCF regions. (A) PPs (in red) and the most similar combination of expert-annotated regions (in green) from the CCFv3 (16) projected on the sagittal and coronal planes. The green regions are selected from a single or a combination of 2, or 3 neighboring regions from all 868 CCF regions with the highest PCC to each PP. The top 10 PPs are shown in descending order of the correlation coefficient. (B) Heatmap of the correlation coefficient between staNMF PPs and each PP’s combination of CCF regions with the highest correlation coefficient. (C) Comparison of the average maximum correlation coefficient of CCF region combinations to each PP for five matrix decomposition and segmentation methods: staNMF, PCA, PCA followed by k-means, PCA followed by hierarchical clustering, and staNMF followed by hierarchical clustering.
