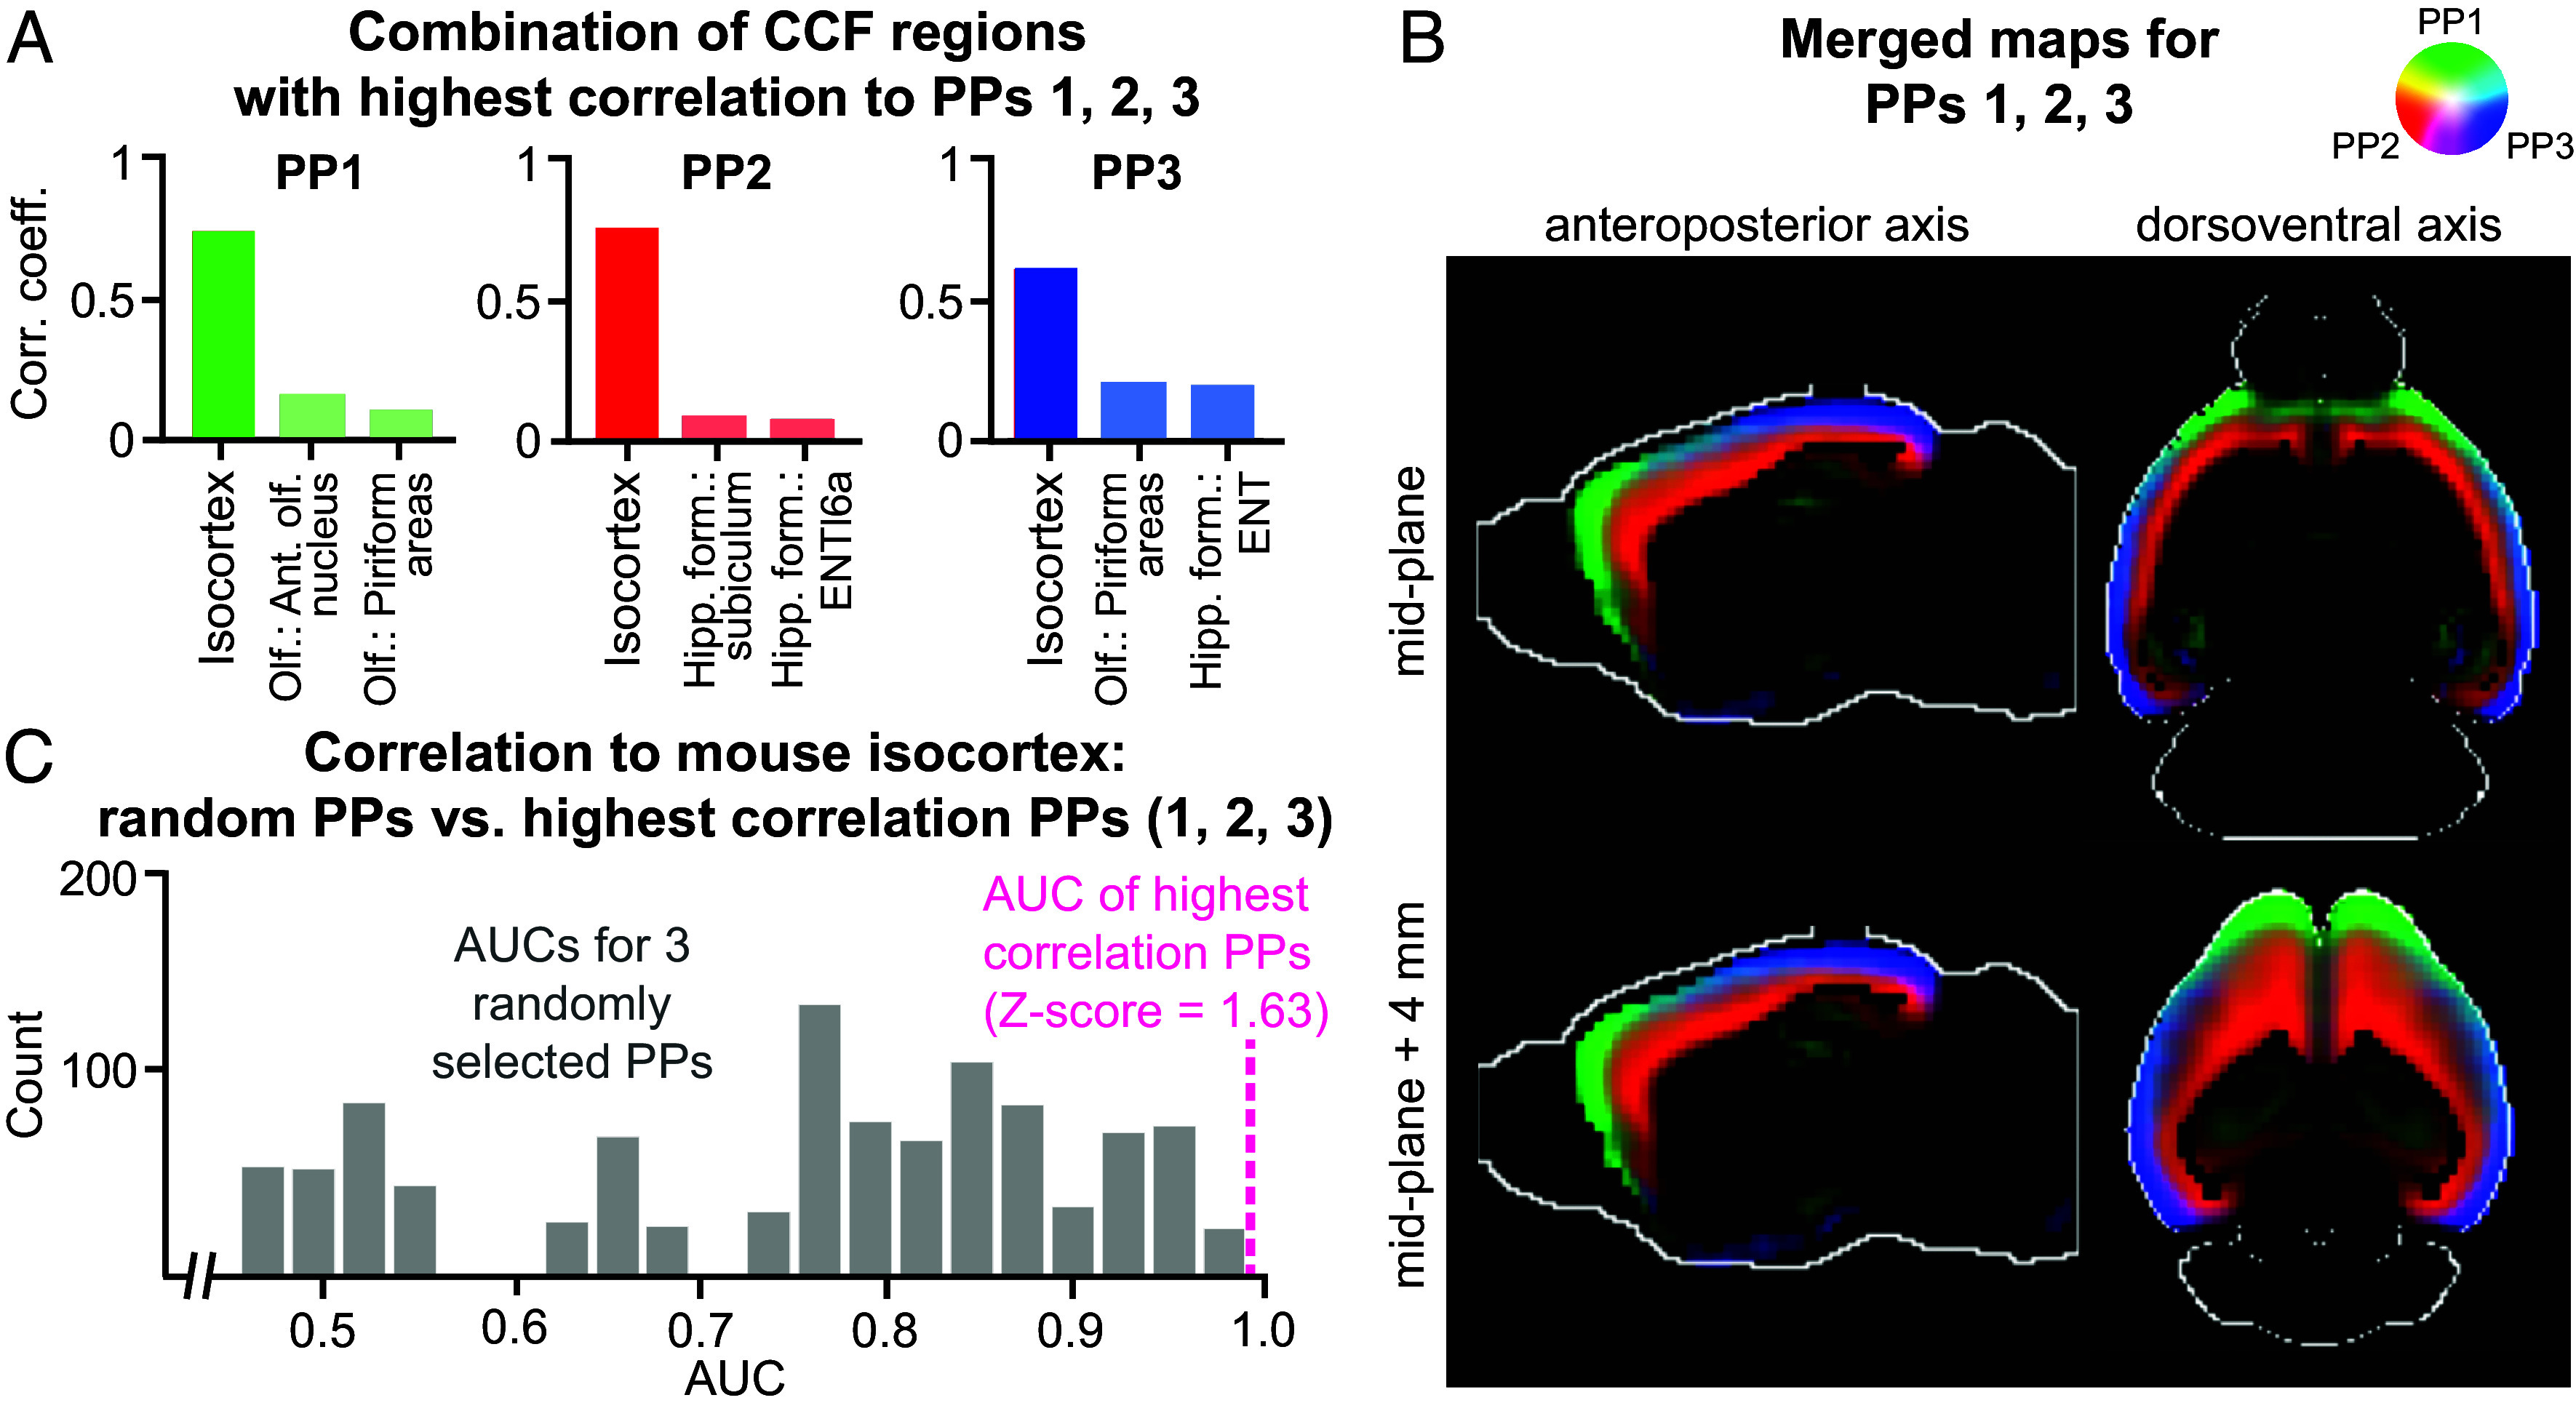
Fig. 4.

The defining PPs for the mouse isocortex. (A) The three CCF regions with the highest correlations with PPs 1 to 3, with the isocortex being the most correlated region. (B) Merged map of the PPs 1 to 3 in the isocortex. Each image is a 2D cross-section viewed along the anteroposterior or dorsoventral axis (two columns). The rows represent the cross-section used in visualization. (C) Histograms of AUC values for isocortex for 1,000 runs of a logistic regression randomly fitting three PPs to isocortex CCF regions. The magenta vertical dashed line indicates that the AUC for PPs 1 to 3 are the best predictors of the isocortex compared to any other three random PPs.
