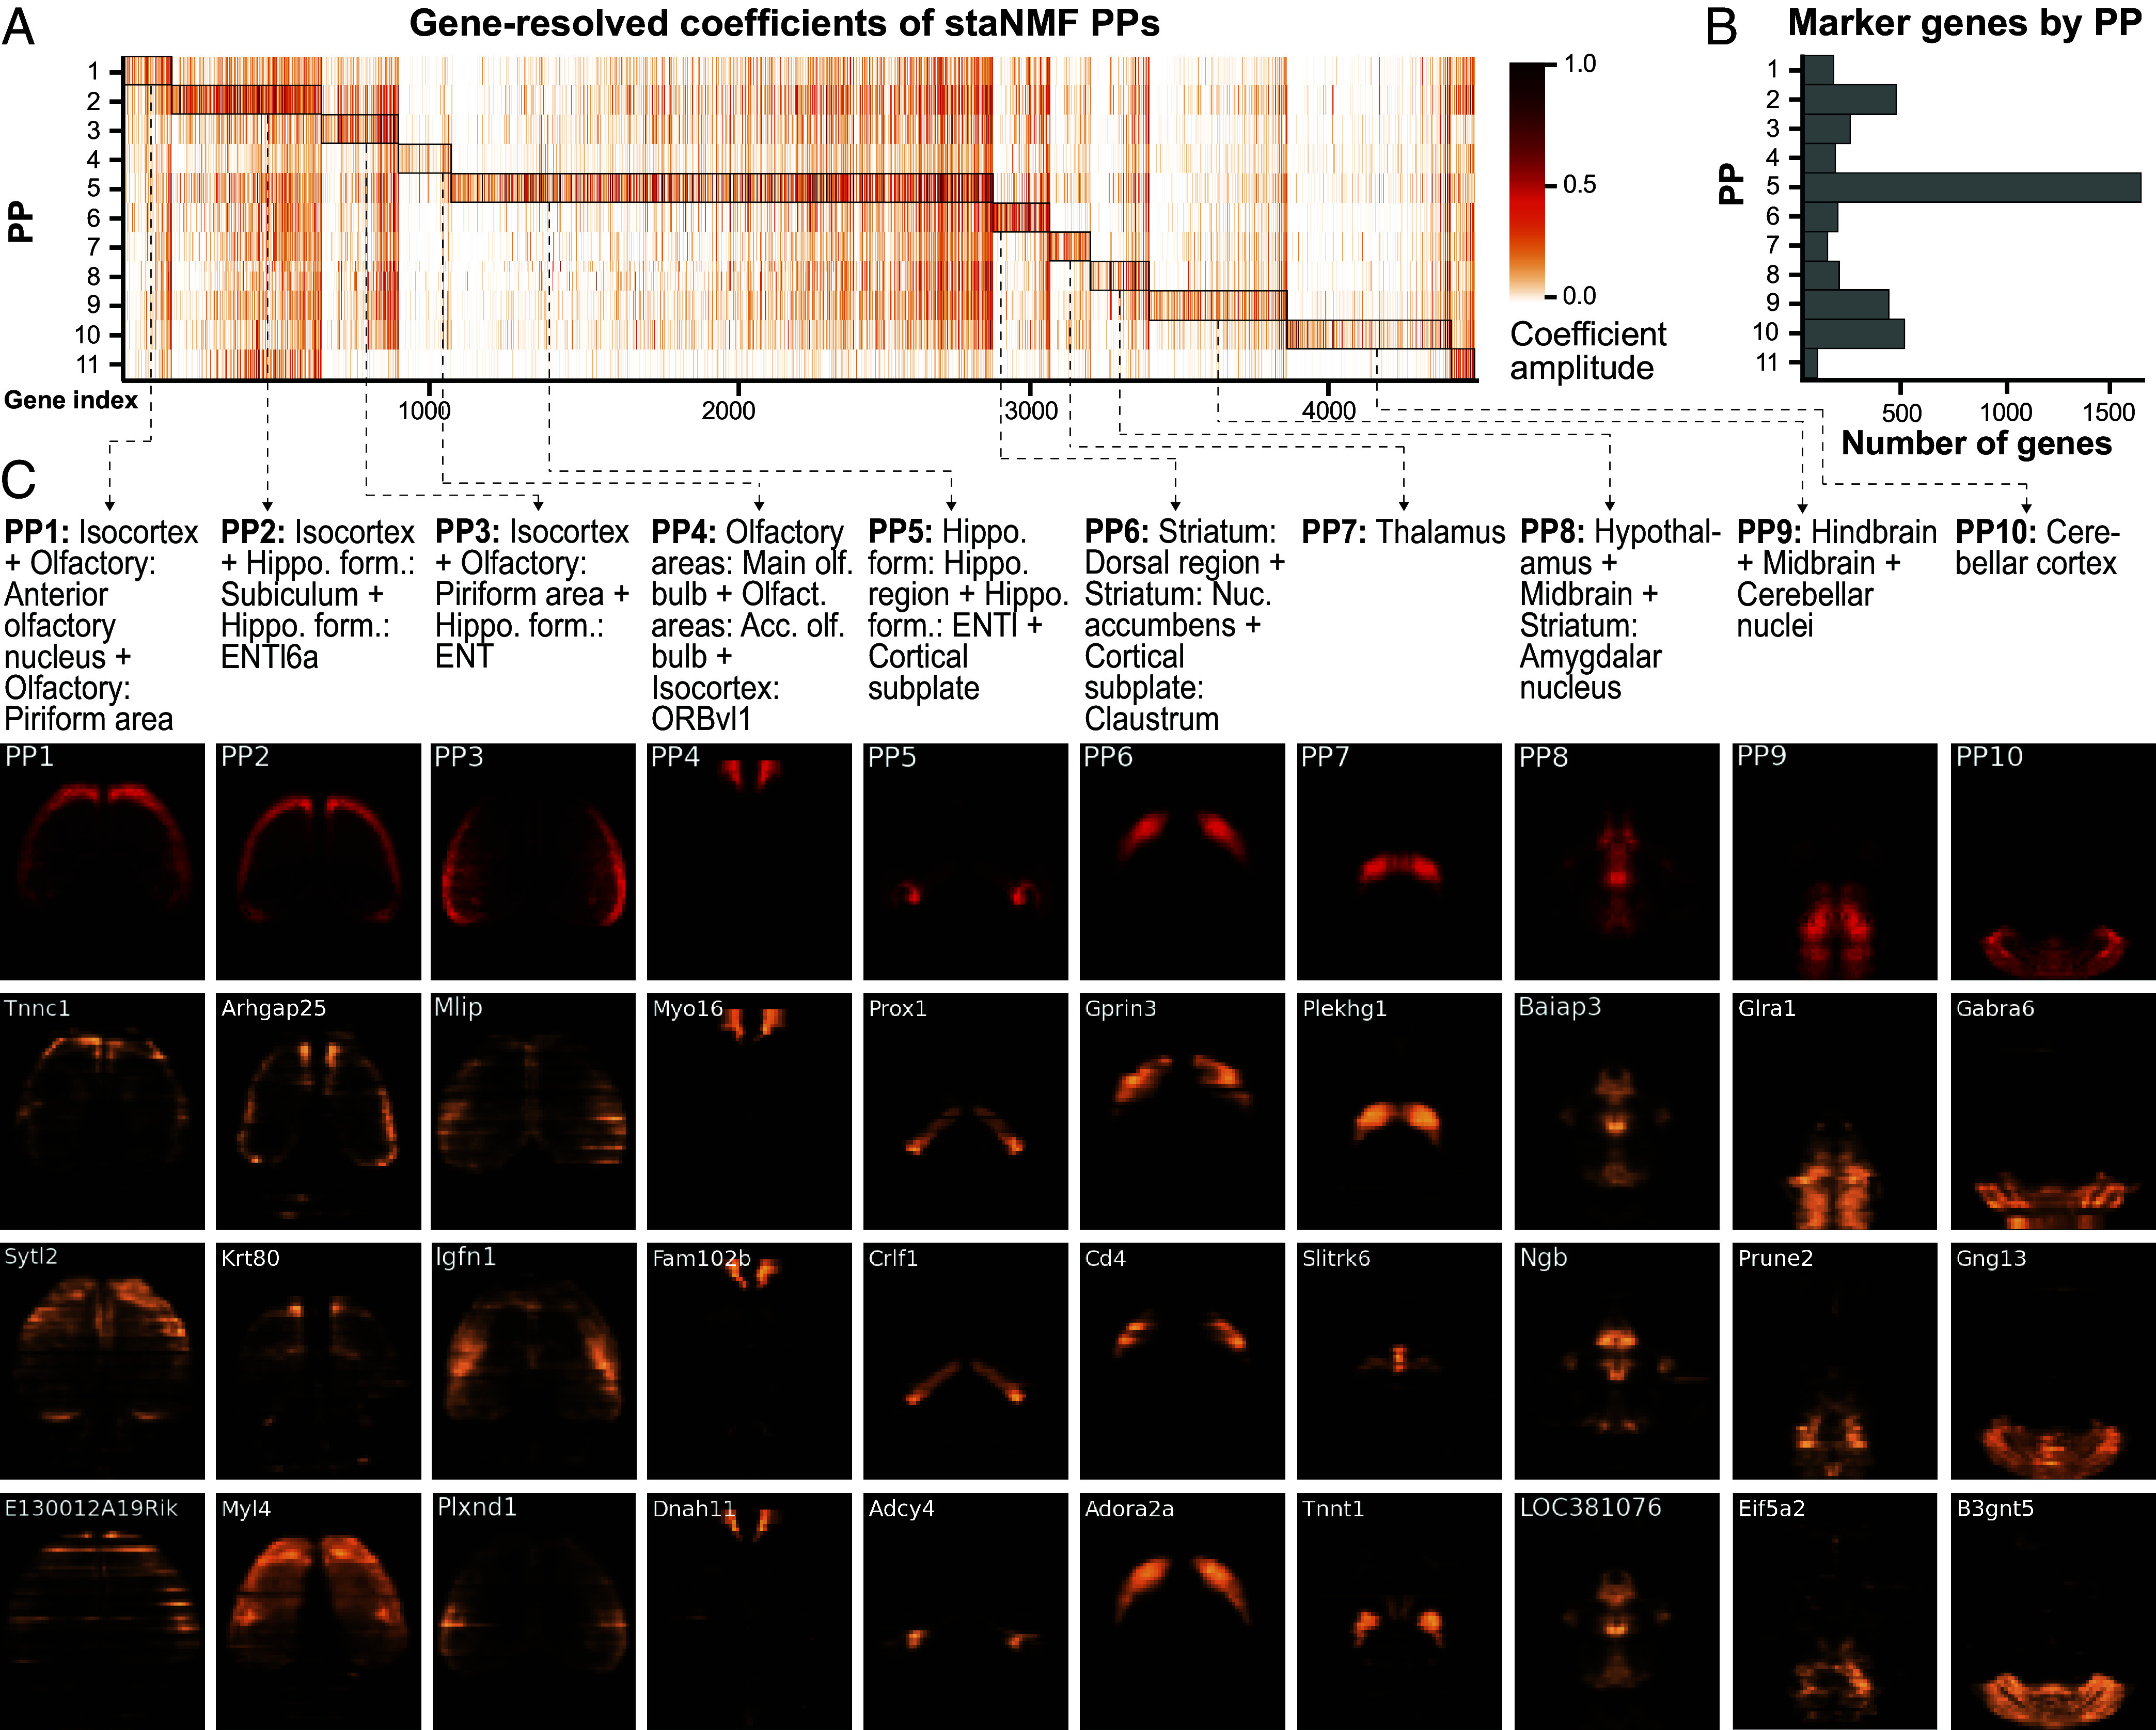
Fig. 5.

Marker gene identification from PPs. (A) Heatmap of the gene-resolved coefficients of the 11 PPs, in descending order by the maximum correlation coefficient to a combination of CCF regions, as described in Fig. 3. Genes are assigned to the PP for which they have the highest coefficients. (B) The number of significant genes for each PP, which is counted from the highlighted regions (by rectangular boxes) in A. (C) The horizontal projection of the respective PP (in red) and the corresponding gene expression of the top three marker genes (in copper). The respective CCF region combinations are provided as text above. The name of the marker gene is displayed in the top left corner of each horizontal view of gene expression.
