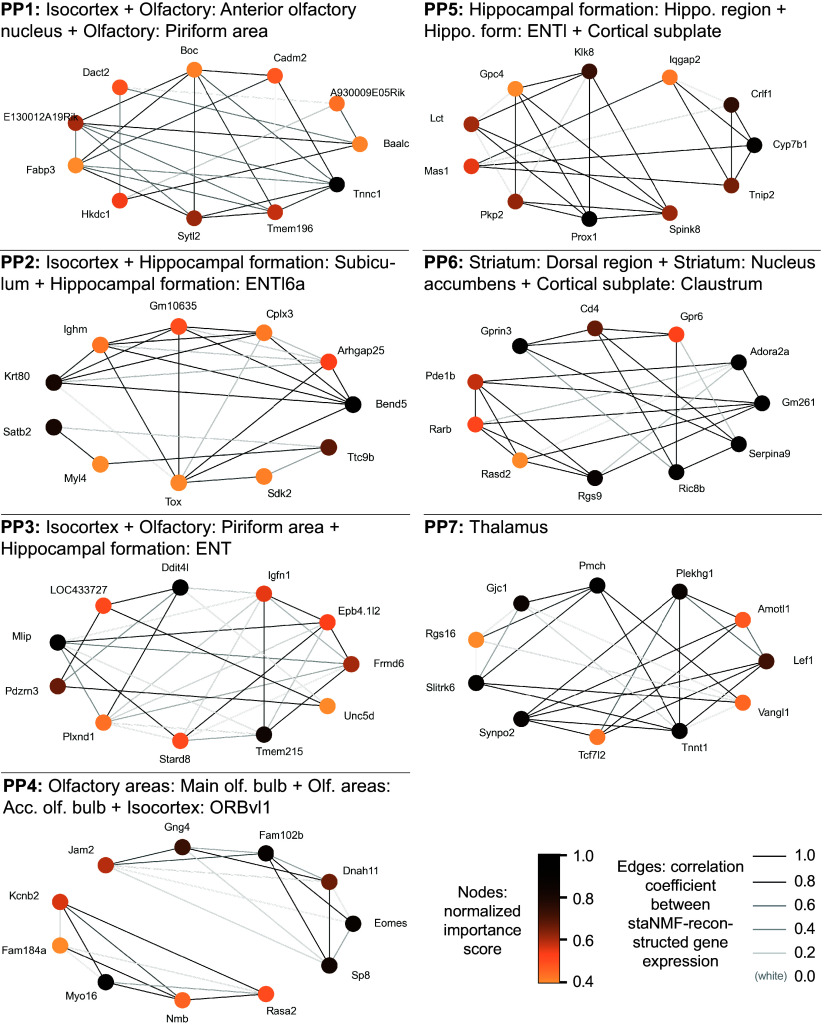
Fig. 6.
Putative spatial gene coexpression network (sGCN) construction. The sGCNs from PPs 1 to 7 and their associated brain regions from the CCFv3 are shown. The node color presents the selectivity of the gene to the PP associated with the brain region. An edge is drawn between genes if the similarity score is among the top 5% of all similarity scores for that gene subset. The edge color is proportional to the Pearson correlation of the reconstructed gene expression images of the two coexpressed genes.

