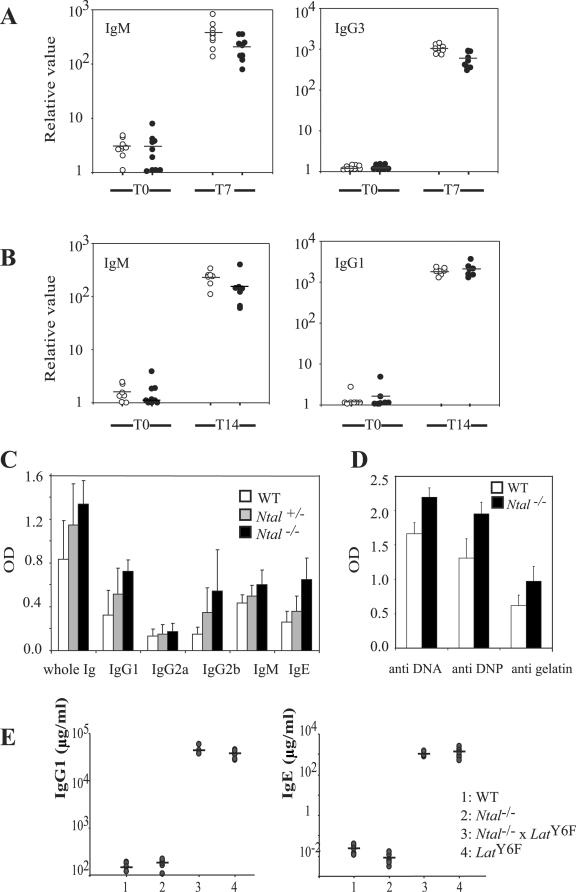
FIG. 7.
Humoral responses in Ntal−/− mice. (A) For measuring B-cell responses to T-independent antigen, group of 8-10 mice (wild-type, open circles; Ntal−/−, solid circles) were immunized with TNP-Ficoll. Mice were bled before (T0) and 7 days (T7) after immunization. TNP-specific immunoglobulins of the indicated isotypes (IgM and IgG3) were assessed in individual mice and plotted on a logarithmic scale. Values represent relative binding units obtained within the linear range of the titration curves compared with a standard nonimmunized control. (B) For measuring B-cell responses to the T-dependent antigen TNP-OVA, groups of 8-10 mice (wild-type, open circles; Ntal−/−, solid circles) were immunized with TNP-OVA and bled before (T0) and 14 days (T14) after immunization. Relative amounts of TNP-specific IgM and IgG1 were analyzed as described in A. Data shown are representative of two independent experiments. (C) Humoral immune response following suboptimal immunization against OVA. Wild-type (n = 6), Ntal+/− (n = 6), and Nta−/− (n = 6) mice were bled 7 days after the second immunization. Total Ig as well as Ig of the indicated isotypes and reactive with OVA were determined by ELISA. (D) Natural antibodies to DNA, DNP, and gelatin were assayed in preimmune sera from wild-type (n = 6) and Ntal−/− (n = 6) mice by ELISA. The concentration of total IgG reactive with the indicated antigens was measured. Differences in both C and D are significant at P < 0.01. (E) Ntal deficiency does not prevent the hypergammaglobulinemia E and G1 that develops in LATY136F mice. The concentrations of IgG1 and IgE in individual mice are plotted on a logarithmic scale. The mean of each distribution is indicated by an horizontal bar.

