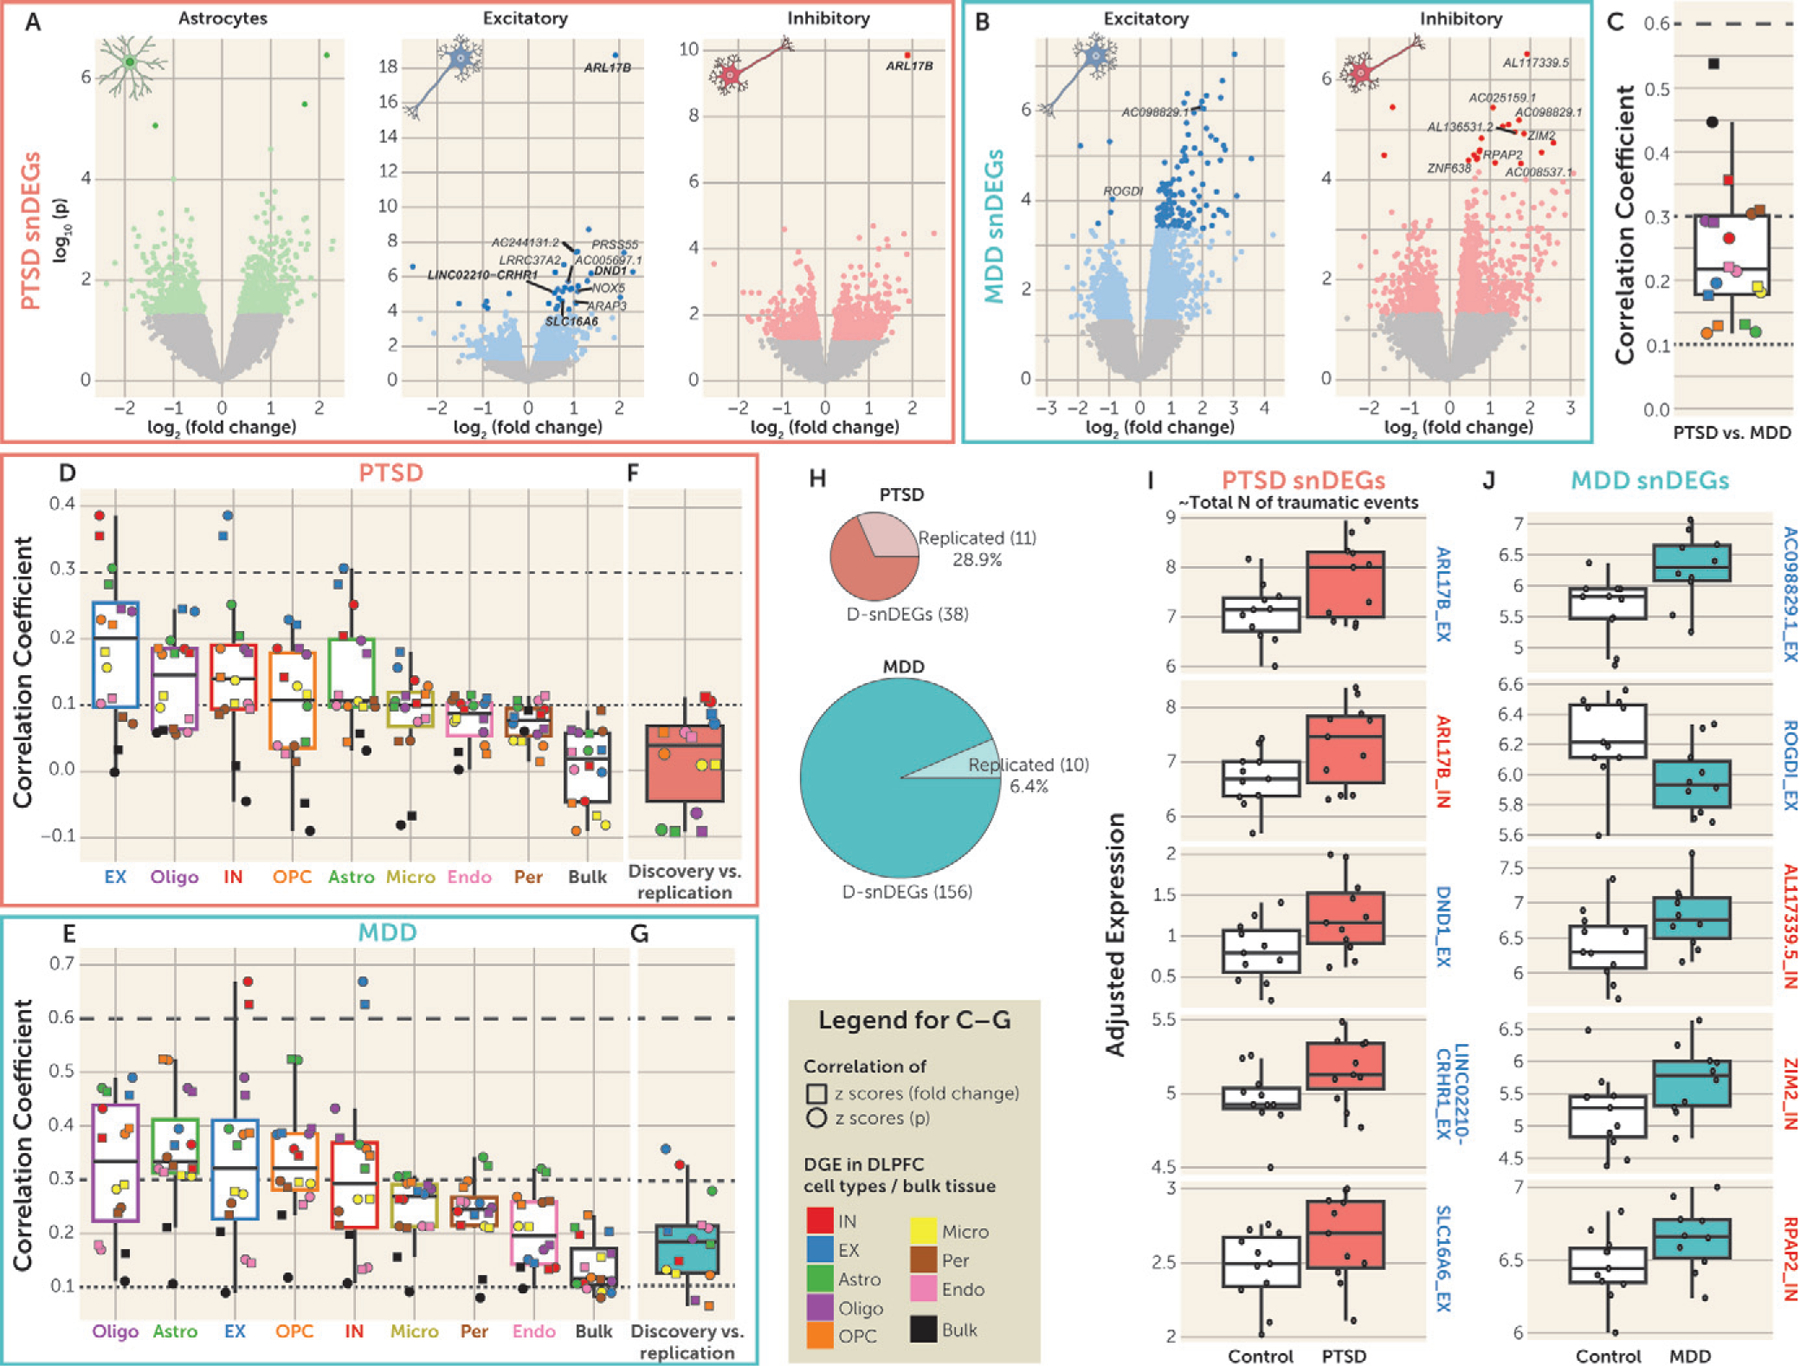
FIGURE 2. Single-nucleus differentially expressed genes (snDEGs) in PTSDa.

a Panel A shows volcano plots of the posttraumatic stress disorder (PTSD) differential gene expression (DGE) of the discovery sample in astrocytes and excitatory (EX) and inhibitory (IN) neurons. Colored dots denote nominally significant genes (p<0.05), and the darker colored dots denote genes with false discovery rate (FDR)–adjusted p<0.05 (termed discovery snDEGs: D-snDEGs). The genes that were found to be snDEGs in the replication data set are named on each plot. D-snDEGs that were also significantly associated with total number of traumatic events (FDR-adjusted p<0.05) are depicted as squares, and their names are in boldface if they were snDEGs in both discovery and replication. Panel B shows volcano plots of the major depressive disorder (MDD) differential gene expression of the discovery sample in EX and IN neurons. Colored dots denote nominally significant genes (p<0.05), and the darker colored dots denote genes with FDR-adjusted p<0.05 (D-snDEGs). The replicated D-snDEGs are named. Panel C shows the correlation of PTSD and MDD DGE in the discovery sample. Two types of correlation analyses were performed: Pearson correlation of standardized scores of fold changes (squares) and signed p values (circles). Data are represented as median ±1.5 interquartile range (IQR), and the individual points denote the correlation between PTSD and MDD for each cell type or bulk tissue. Dashed lines at coefficients 0.1, 0.3, and 0.6 annotate weak, moderate, and high strength of correlation, respectively. Panels D and E show the correlation of the DGE in association with PTSD and MDD, respectively, between cell types or bulk tissue in the discovery sample. Two types of correlation analyses were performed: Pearson correlation of standardized scores of fold changes (squares) and signed p values (circles). Cell type/bulk tissue box plots are ordered from highest (left) to lowest (right) median correlation. Data are represented as median ±1.5 IQR, and the individual points denote the correlation at each cell type or bulk tissue. Dashed lines at coefficients 0.1, 0.3, and 0.6 annotate weak, moderate, and high strength of correlation, respectively. Panels F and G show the correlation ofthe DGE in association with PTSD and MDD, respectively, between the discovery and replication samples. Two types of correlation analyses were performed: Pearson correlation of standardized scores of fold changes (squares) and signed p values (circles). Data are represented as median ±1.5 IQR, and the individual points denote the correlation at each cell type or bulk tissue. Dashed lines at coefficients 0.1, 0.3, and 0.6 annotate weak, moderate, and high strength of correlation, respectively. Panel H presents pie charts of the number of D-snDEGs and replicated D-snDEGs for PTSD and MDD. Panels I and J summarize the expression of the top five replicated D-snDEGs in association with PTSD/total number of traumatic events and MDD, respectively, in the discovery data set. The replicated D-snDEGs are ranked according to the p value in the discovery data set (lowest p values at the top). The red boxes correspond to the PTSD group (N=11), the green boxes to the MDD group (N=10), and the white boxes to the control group (N=11). The depicted genes are either EX (blue outline) or IN (red outline) neurons’ D-snDEGs. The y-axis depicts adjusted expression. Data are represented as median ±1.5 IQR, and the individual subject values are depicted as circles. For each gene, the t statistic and p value of the group differences (PTSD vs. control and MDD vs. control) were estimated by the limma-based DGE analysis and are included in Tables S6 and S7 in the online supplement.
