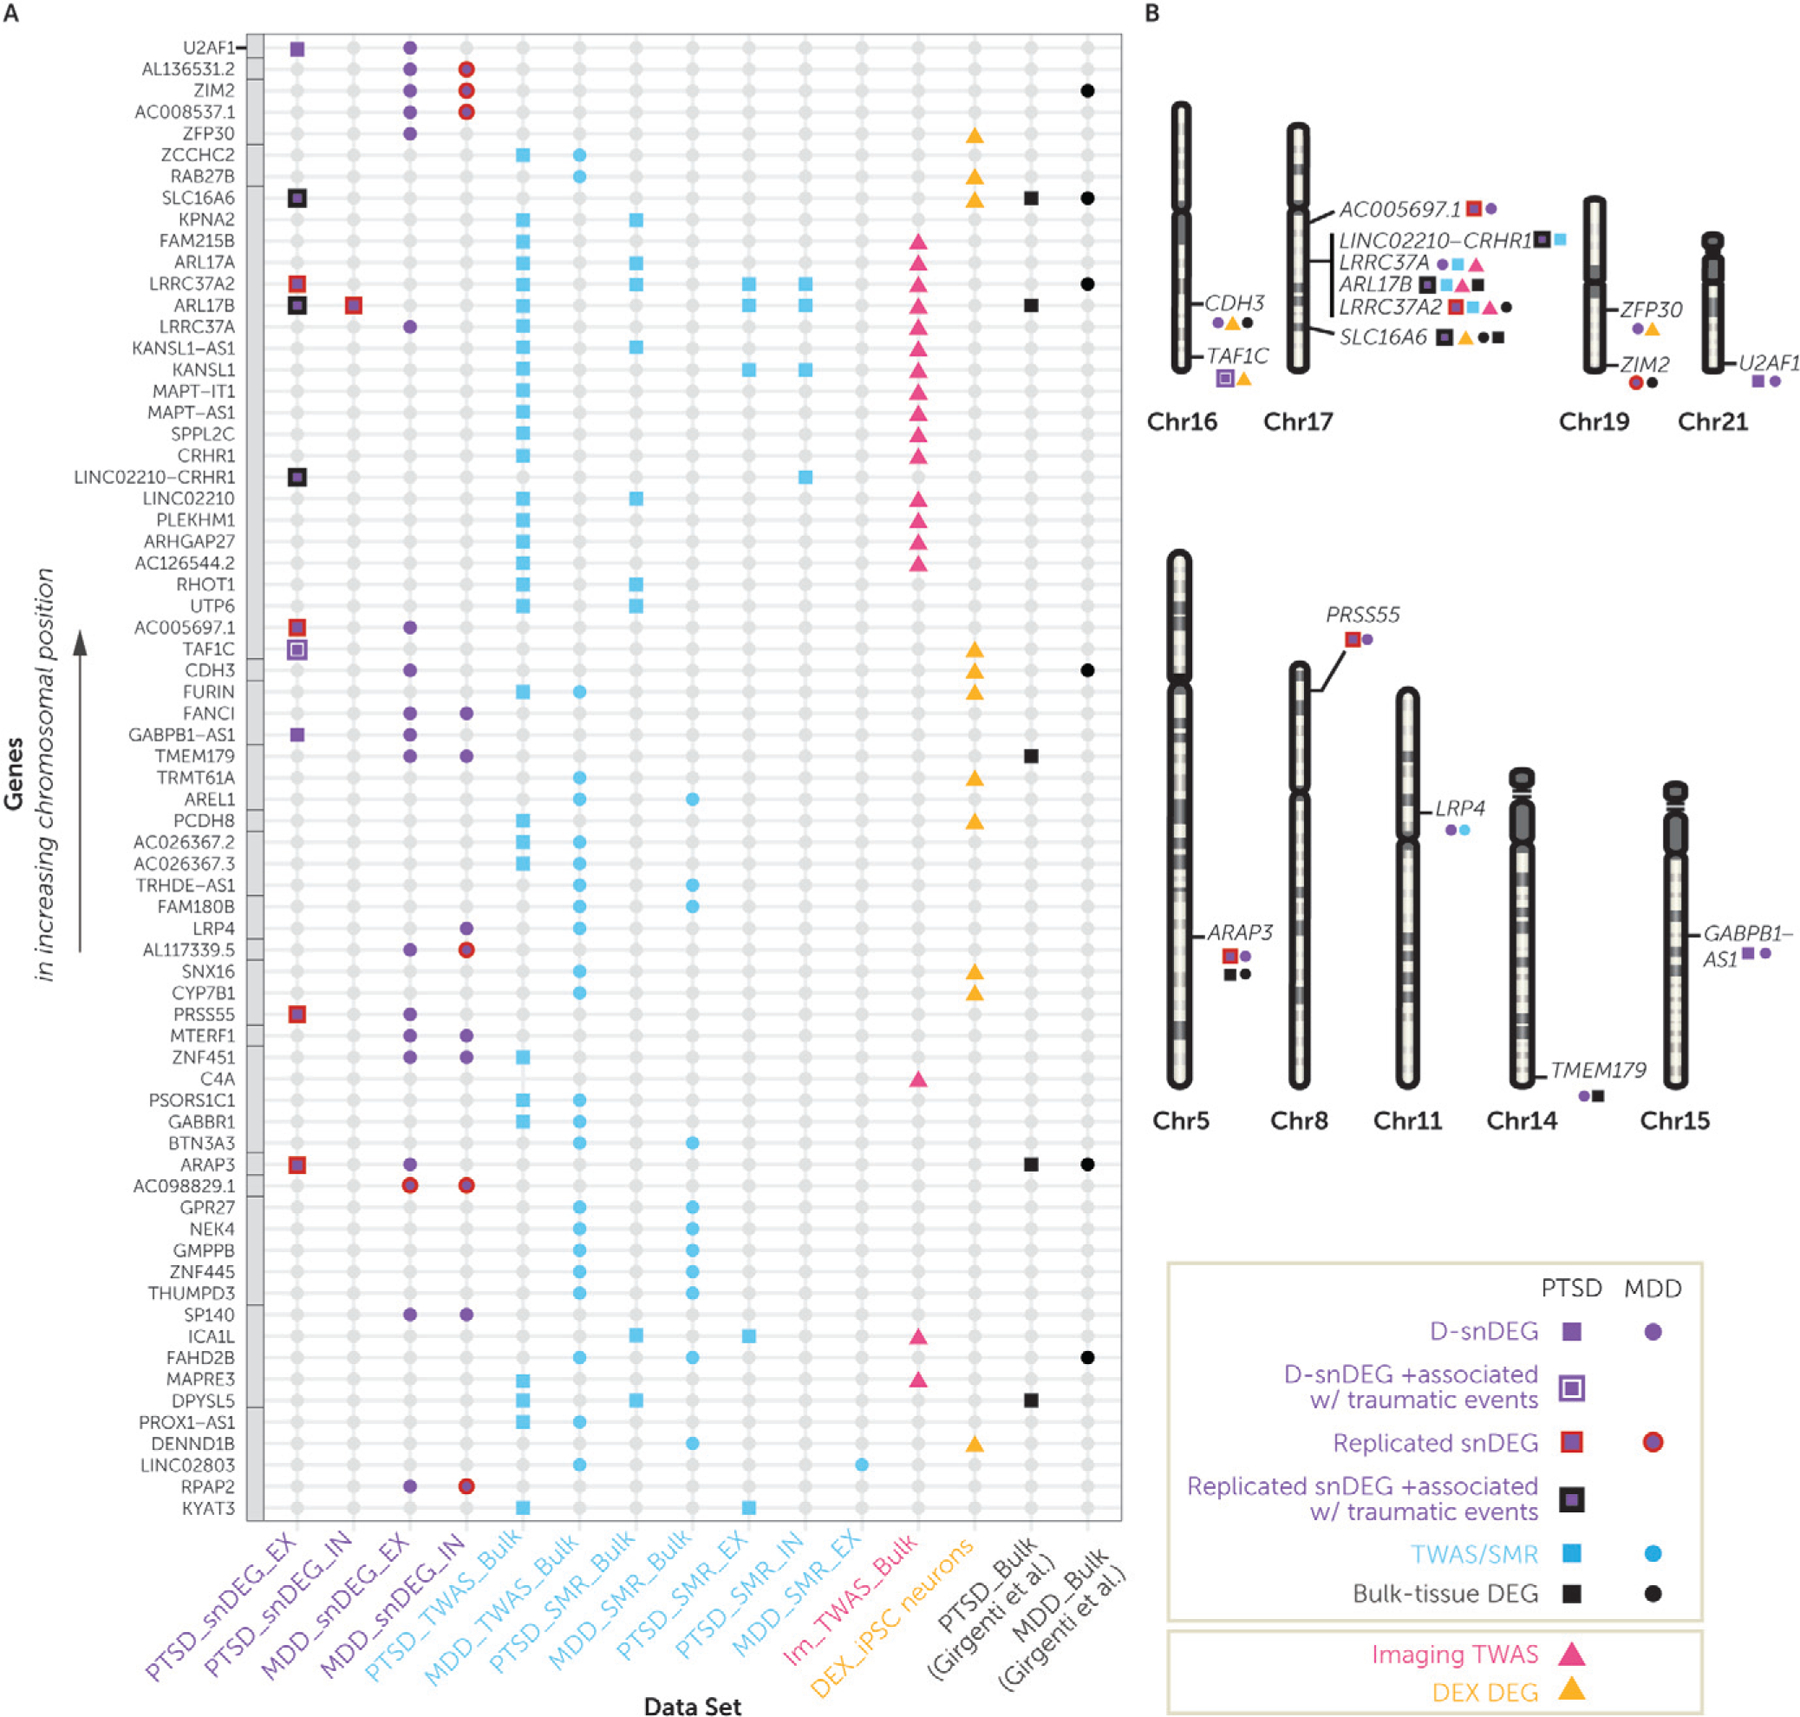
FIGURE 5. Highlighting the most important genes upon integration of all the reported data modalities in this studya.

a Panel A is an integrative dot plot with all genes that were false discovery rate (FDR) significant in at least two analyses used in this study. The genes are listed from bottom to top in increasing chromosomal position order, with the gray boxes annotating genes that belong to the same chromosome. Purple denotes significant results from the dorsolateral prefrontal cortex (DLPFC) single-nucleus RNA-seq analysis; squares depict significant posttraumatic stress disorder (PTSD) single-nucleus differentially expressed genes in the discovery data set (D-snDEGs), and circles depict major depressive disorder (MDD) D-snDEGs. A purple line surrounding the square indicates that the PTSD D-snDEG was also associated with number of traumatic events, and a black line surrounding the square indicates that a replicated PTSD D-snDEG was also associated with number of traumatic events. Blue denotes significant results from DLPFC-based transcriptome-wide association study (TWAS) or summary-data-based Mendelian randomization (SMR) analyses; squares depict PTSD FDR-significant genes, and circles depict MDD FDR-significant genes. Pink triangles denote TWAS genes of DLPFC-based neuroimaging, and orange triangles denote FDR-significant genes based on dexamethasone (DEX) treatment in iPSC-derivedneurons. Black denotes significant results from the previous DLPFC bulk-tissue RNA-seq study (22), with squares and circles depicting PTSD and MDD FDR-significant differentially expressed genes, respectively. In panel B, D-snDEG genes that were significant in more than one data modality or in both disorders in any modality are depicted on their chromosomal location. The 17q21.31 locus had four of such genes, and there was no other locus with more than one such gene.
