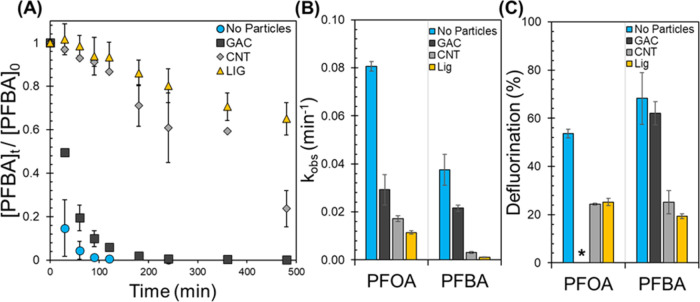
Figure 3.
(A) PFBA decomposition with 20 mM SO3–2 and 254 nm UV light at pH10, without and with 1 g/L particles (GAC, CNT, LIG). [PFBA]o = 12 μM. Error bars represent the standard error of replicate measurements (n = 3 for CNT, n = 2 for the rest). (B) Observed pseudo-first-order rate constants (kobs) for PFOA and PFBA (12 μM initial concentration) without and with particles. kobs for PFOA in the presence of GAC was measured from the aqueous PFOA disappearance. For the rest, kobs were measured from the total disappearance profile of each compound, thus the sum of the aqueous and solid phases. (C) Percent defluorination for PFOA at t = 180 min and PFBA at t = 480 min without and with particles. *Fluoride was not detected (LOD = 0.02 ppm F–) when PFOA was reacted with GAC.

