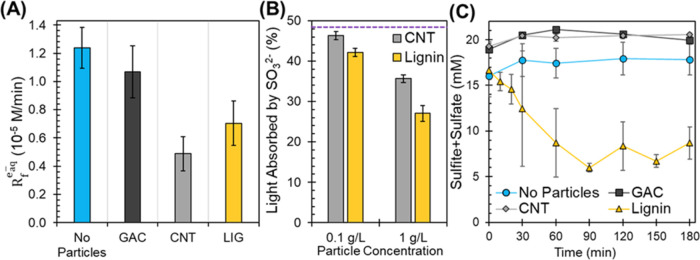
Figure 4.
(A) Mean hydrated electron formation rates (Reaq–f) of each system calculated from the slope of the inverse MCAA pseudo-first-order rate constant (kobs–1, min) as a function of initial MCAA concentration from Figure S12. Error bars represent the standard error from the slope regression. (B) Percent of total light (254 nm) absorbed by SO32– (20 mM) at pH10 for different CNT and lignin concentrations measured through spectrophotometry. The dashed purple line indicates the percent light absorbed by 20 mM SO32– at pH10 without particles. (C) Combined sulfite and sulfate (SO32– + SO42–) concentration (mM) with time of UV exposure in PFOA degradation experiments. Initial sulfite concentration is 20 mM and PFOA concentration of 12 μM at pH10 with 1 g/L particles. Error bars represent standard errors of experimental duplicates.

