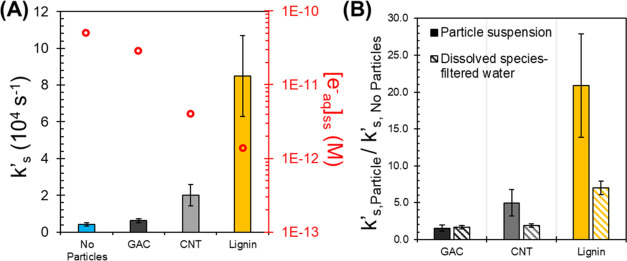
Figure 5.
(A) Bars represent mean hydrated electron scavenging capacities (k′S) without and with 1 g/L of particles during UV/sulfite treatment calculated with eq 11 (left y-axis). Error bars represent the propagated standard error. Red circular markers represent the steady-state hydrated electron concentration ([eaq–]ss) for each system estimated from PFBA kinetic data and bimolecular rate constant using eq 10 (right y-axis). (B) Ratio of hydrated electron scavenging capacities of particle exposed samples (k′s,Particle) over no particle controls (k′s,No Particles). The solid colored bars (Particle suspensions) represent the k′s,Particle/k′s,No Particles ratio for each particle suspension shown in part (A). The striped colored bars (Dissolved species-filtered water) represent the estimated k′s,Particle/k′s,No Particles ratio of dissolved species from the filtered water of the UV/sulfite exposed suspensions discussed in Text S5. Error bars represent the propagated standard error.

