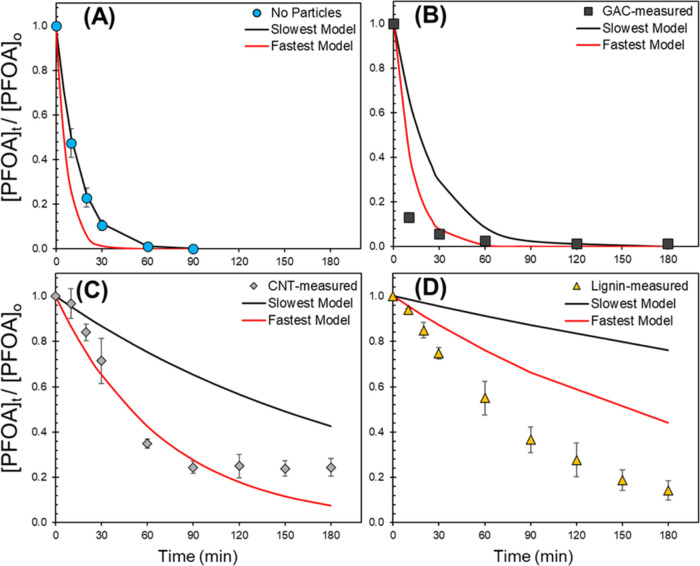
Figure 6.
Modeling PFOA degradation in UV/SO3–2 with estimated values of hydrated electron formation rate (Reaq–f) and scavenging capacity (k′S) in (A) No Particles, (B) GAC, (C) CNT, and (D) Lignin systems. The markers illustrate measured total (aqueous + sorbed) PFOA degradation. Black and red lines represent the lower (lowest generation Reaq–f, highest scavenging k′S) and upper (highest generation Reaq–f, lowest scavenging k’S) bounds on the kinetic models respectively based on the standard error measured for these parameters (Reaq–f and k′S) for each system (No Particles, GAC, CNT, and Lignin). Experiments were run at pH 10 with 20 mM initial SO3–2 and [PFOA]0 = 12 μM (*for GAC, [PFOA]0,aq = 0.1 μM), irradiated with 254 nm light at ambient temperature (20 °C). The bimolecular rate constant kPFOA= 3.40 × 10⁷ M–1 s–1 is an average from reported literature values from Huang et al. (5.10 × 10⁷ M–1 s–1)77 and Szajdzinska-Pietek et al. (1.70 × 10⁷ M–1 s–1).78 Markers are the means of experimental duplicates, and error bars represent their standard error. *In the GAC system (B), measured PFOA concentrations are only from the aqueous phase ([PFOA]0,aq = 0.1 μM), thus excluding adsorbed PFOA.

