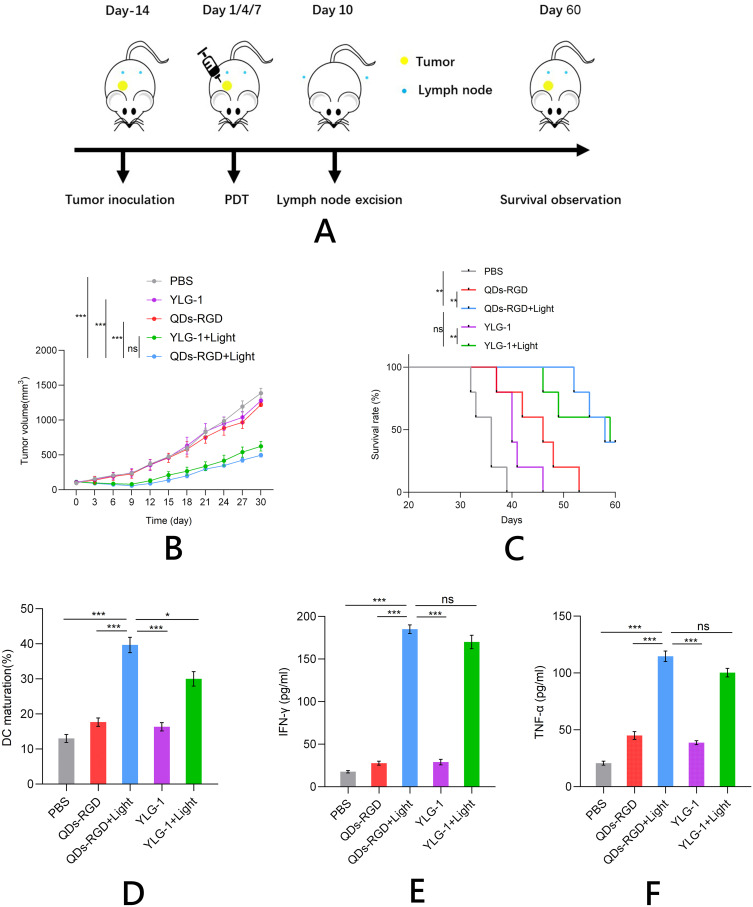
Figure 5.
Anti-tumor performance and immunity induced by PDT in vivo.
Notes: (A) Schematic illustration of the experiment; (B) and (C) Growth curves for pancreatic tumors (B) and survival rate (C) on mice after various treatments indicated; (D–F) ICD induction of various treatments in vivo, including DC maturation (D), secretion of IFN-γ (E) and TNF-α (F). Data are expressed as means ± SEM (n = 5). *P < 0.05, **P < 0.01, ***P < 0.001, ns, not significant.
Abbreviations: QDs-RGD, quantum dots conjugated with arginine-glycine-aspartic acid peptide sequence; YLG-1, (17R,18R)-2-(1-hexyloxyethyl)-2-devinyl chlorine E6 trisodium salt; PBS, phosphate-buffered saline; PDT, photodynamic therapy; DC, dendritic cell; ICD, immunogenic cell death; SEM, standard error of the mean.

