
Fig. 8 ∣. Violin plots of the η values of 262 single cells in three studies.
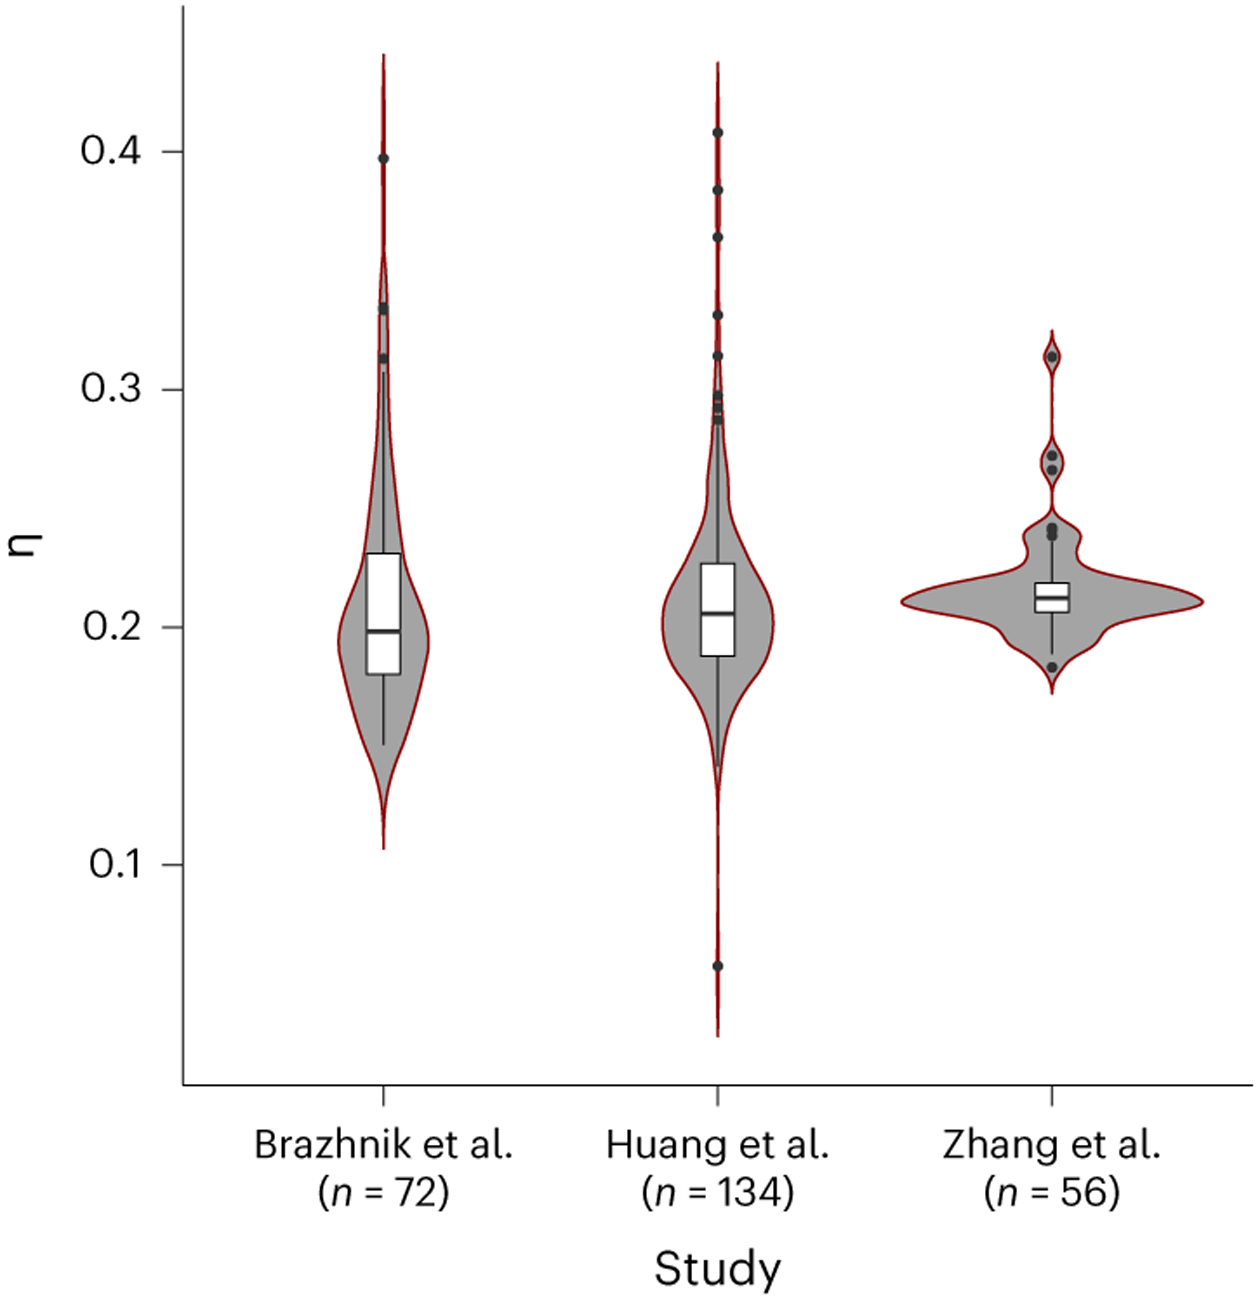
Average η value of autosomes per cell was calculated for each single cell in the three studies18-20. Box plot elements are defined as follows: center line indicates median, box limits indicate upper and lower quartiles, whiskers indicate 1.5× interquartile range and points indicate the outliers of the box plots.