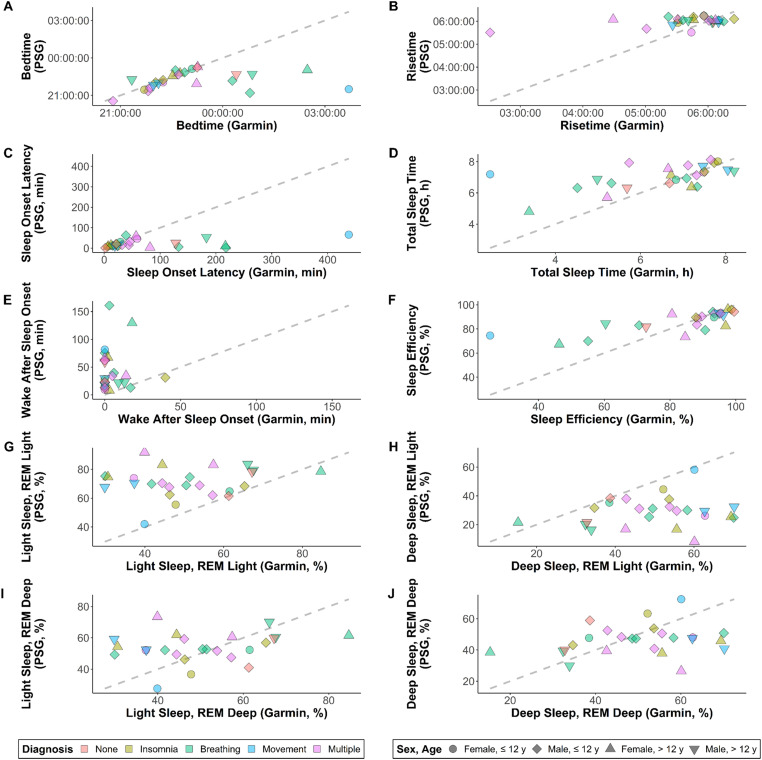
Figure 1.
Scatterplots showing raw data for Garmin Vivofit 4 on the x-axis and polysomnography (PSG) on y-axis, with color- and shape-coding to show trends among diagnostic and demographic subgroups. The dashed line is the line of identity, representing perfect agreement. Variables shown are (a) bedtime, (b) risetime, (c) sleep onset latency, (d) total sleep time, (e) wake after sleep onset, (f) sleep efficiency, (g) percent of time in light sleep when classifying rapid eye movement as light (REM Light), (h) percent of time in deep sleep for REM Light, (i) percent of time in light sleep when classifying REM as deep (REM Deep), and (j) percent of time in deep sleep for REM Deep. For sleep onset latency and sleep efficiency, N = 24 rather than 25, due to the Garmin monitor predicting bedtime before “lights out” for one participant.

