Fig. 1.
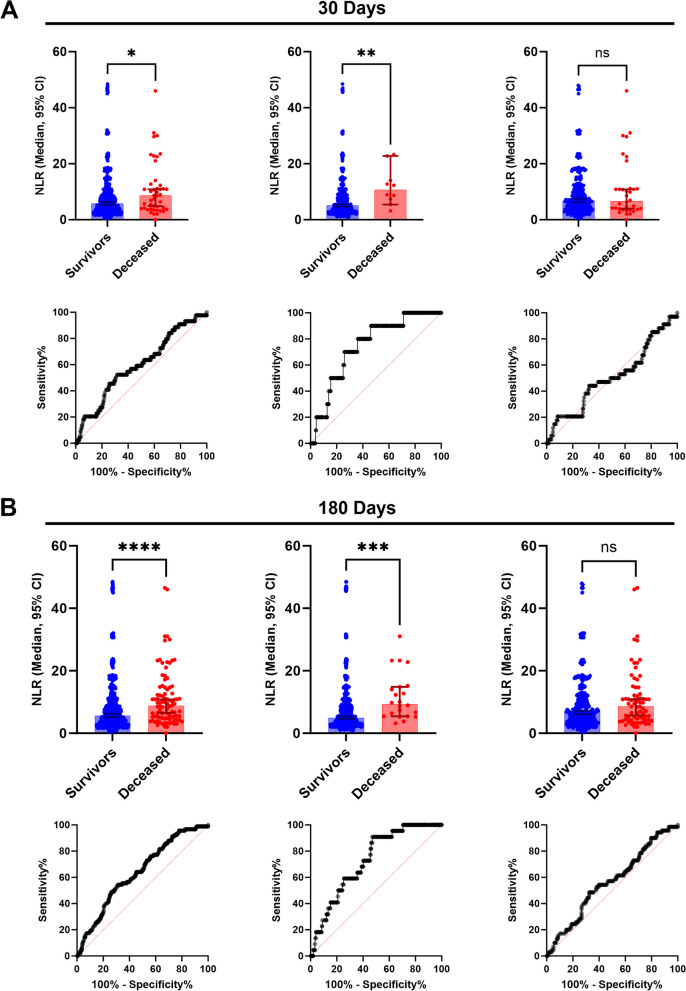
A 30 days mortality analysis between survivor and deceased patients. Upper panel, neutrophil-to- lymphocyte ratio median differences: Total population (left), patients younger than 65 years (Middle) and, 65 years and above patients (Right). * 0.0302, ** p=0.0064, ns p=0.9068; Mann–Whitney U test. Lower panel, ROC curves: Total population AUC 0.60 (left), patients younger than 65 years AUC 0.75 (Middle) and, 65 years and above patients AUC 0.51 (Right). B 180 days mortality analysis between survivor and deceased patients. Upper panel, neutrophil-to- lymphocyte ratio median differences: Total population (left), patients younger than 65 years (Middle) and, 65 years and above patients (Right). **** <0.0001, *** p=0.0002, ns p=0.0991; Mann–Whitney U test. Lower panel, ROC curves: Total population AUC 0.64 (left), patients younger than 65 years AUC 0.73 (Middle) and, 65 years and above patients AUC 0.56 (Right)

