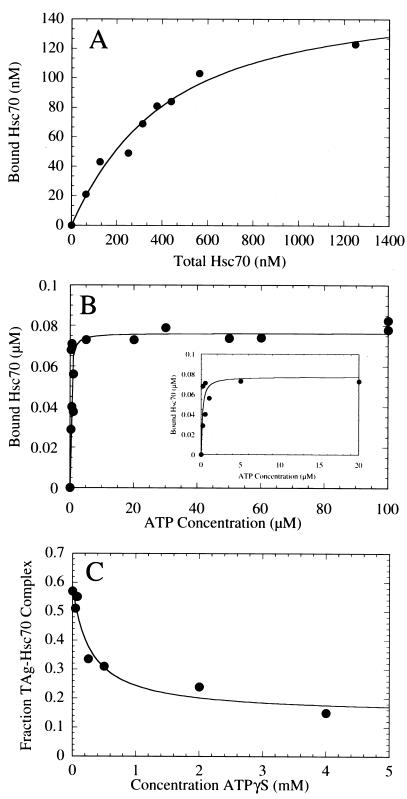
FIG. 2.
T-antigen–Hsc70 complex formation. (A) Saturation binding of Hsc70 to T antigen. This graph presents the quantification of the Hsc70 concentration dependence seen in the Coomassie blue-stained gel shown in Fig. 3C. T antigen at 120 nM was incubated with Hsc70 (0 to 1,250 nM) in the presence of 1 mM MgATP plus an ATP regeneration system as described in Materials and Methods. The concentration of Hsc70 partitioning with T antigen was plotted as a function of the total Hsc70 concentration. The fit of the data to the quadratic equation (equation 1) yields the apparent Kd,Hsc70 310 ± 60 nM, with maximum binding at 159 ± 13.0 nM Hsc70. (B) ATP-dependent association of Hsc70 with T antigen. The gel in Fig. 3A was quantified, and the association of Hsc70 (300 nM) with T antigen (120 nM) was plotted as a function of MgATP concentration. The data were fitted to the quadratic equation (equation 2) which provides the apparent Kd, ATP, 0.16 ± 0.07 μM, with maximum binding at 76 ± 4.5 nM Hsc70. Only the data from 0.2 to 100 μM MgATP are shown, and the inset presents the data from 0 to 20 μM MgATP. (C) Inhibition by ATPγS of the ATP-induced T-antigen–Hsc70 association. T-antigen–Hsc70 complex formation (300 nM T antigen, 300 nM Hsc70) was initiated in the presence of 50 μM MgATP plus increasing concentrations of MgATPγS (0 to 4,000 μM). The T-antigen–Hsc70 complexes were immunoprecipitated with anti-T-antigen antibody PAb416 and quantified. The fraction of T-antigen–Hsc70 complex was plotted as a function of ATPγS concentration, and the fit of the data to a hyperbola provides the K0.5,ATPγS, 286 ± 132 μM ATPγS. The apparent Kd, ATPγS P is 0.91 μM (equation 3).

