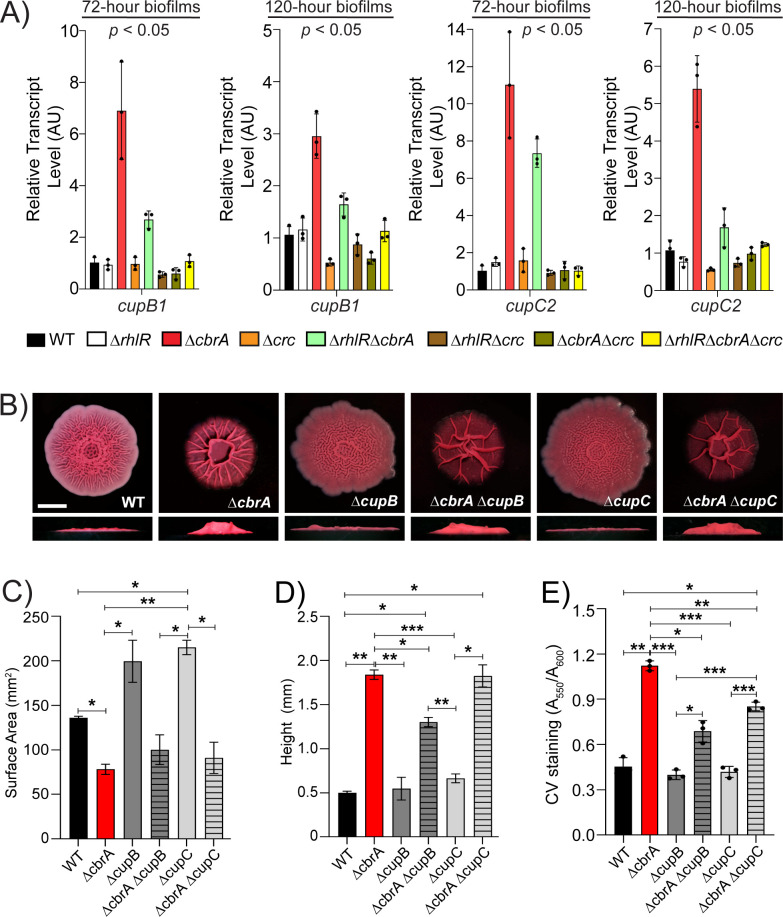
Fig 7.
The cupB and cupC fimbrial operons are overexpressed in the absence of CbrA. (A) Relative expression of cupB1 and cupC2 genes normalized to 16S RNA, ostA, and rpsO transcript levels in WT PA14 and indicated mutants after 72 and 120 h of colony biofilm growth. AU denotes arbitrary units. Error bars represent the standard deviation of three biological replicates. Statistical significance was determined using Welch’s ANOVA in GraphPad Prism software. For cupB1 expression at 72 and 120 h, the following comparisons were statistically significant (P < 0.05): ΔcbrA vs all other strains. For cupC2 expression at 72 h, the following comparisons were statistically significant (P < 0.05): ΔcbrA vs all other strains except ΔrhlRΔcbrA, and ΔrhlRΔcbrA vs all other strains except ΔcbrA. For cupC2 expression at 120 h, the following comparisons were statistically significant (P < 0.05): ΔcbrA vs all other strains except ΔrhlRΔcbrA mutant. (B) Colony biofilm phenotypes of WT PA14 and the designated mutants on Congo red agar medium after 120 h of growth. Scale bar, 5 mm. (C) Colony biofilm surface area quantitation for the indicated strains after 120 h of growth. Error bars represent the standard deviation of three independent experiments. (D) Colony biofilm height quantitation for the indicated strains after 120 h of growth. Error bars represent the standard deviation of three independent experiments. (E) Biofilm crystal violet staining assays for WT and indicated mutant strains. Error bars represent the standard deviation of three biological replicates. (C–E) Only pairwise comparisons that had P value < 0.05 are denoted. Statistical significance was determined using Welch’s ANOVA with Dunnett’s T3 multiple comparisons test in GraphPad Prism software. ***P < 0.001, **P < 0.01, *P < 0.05.

