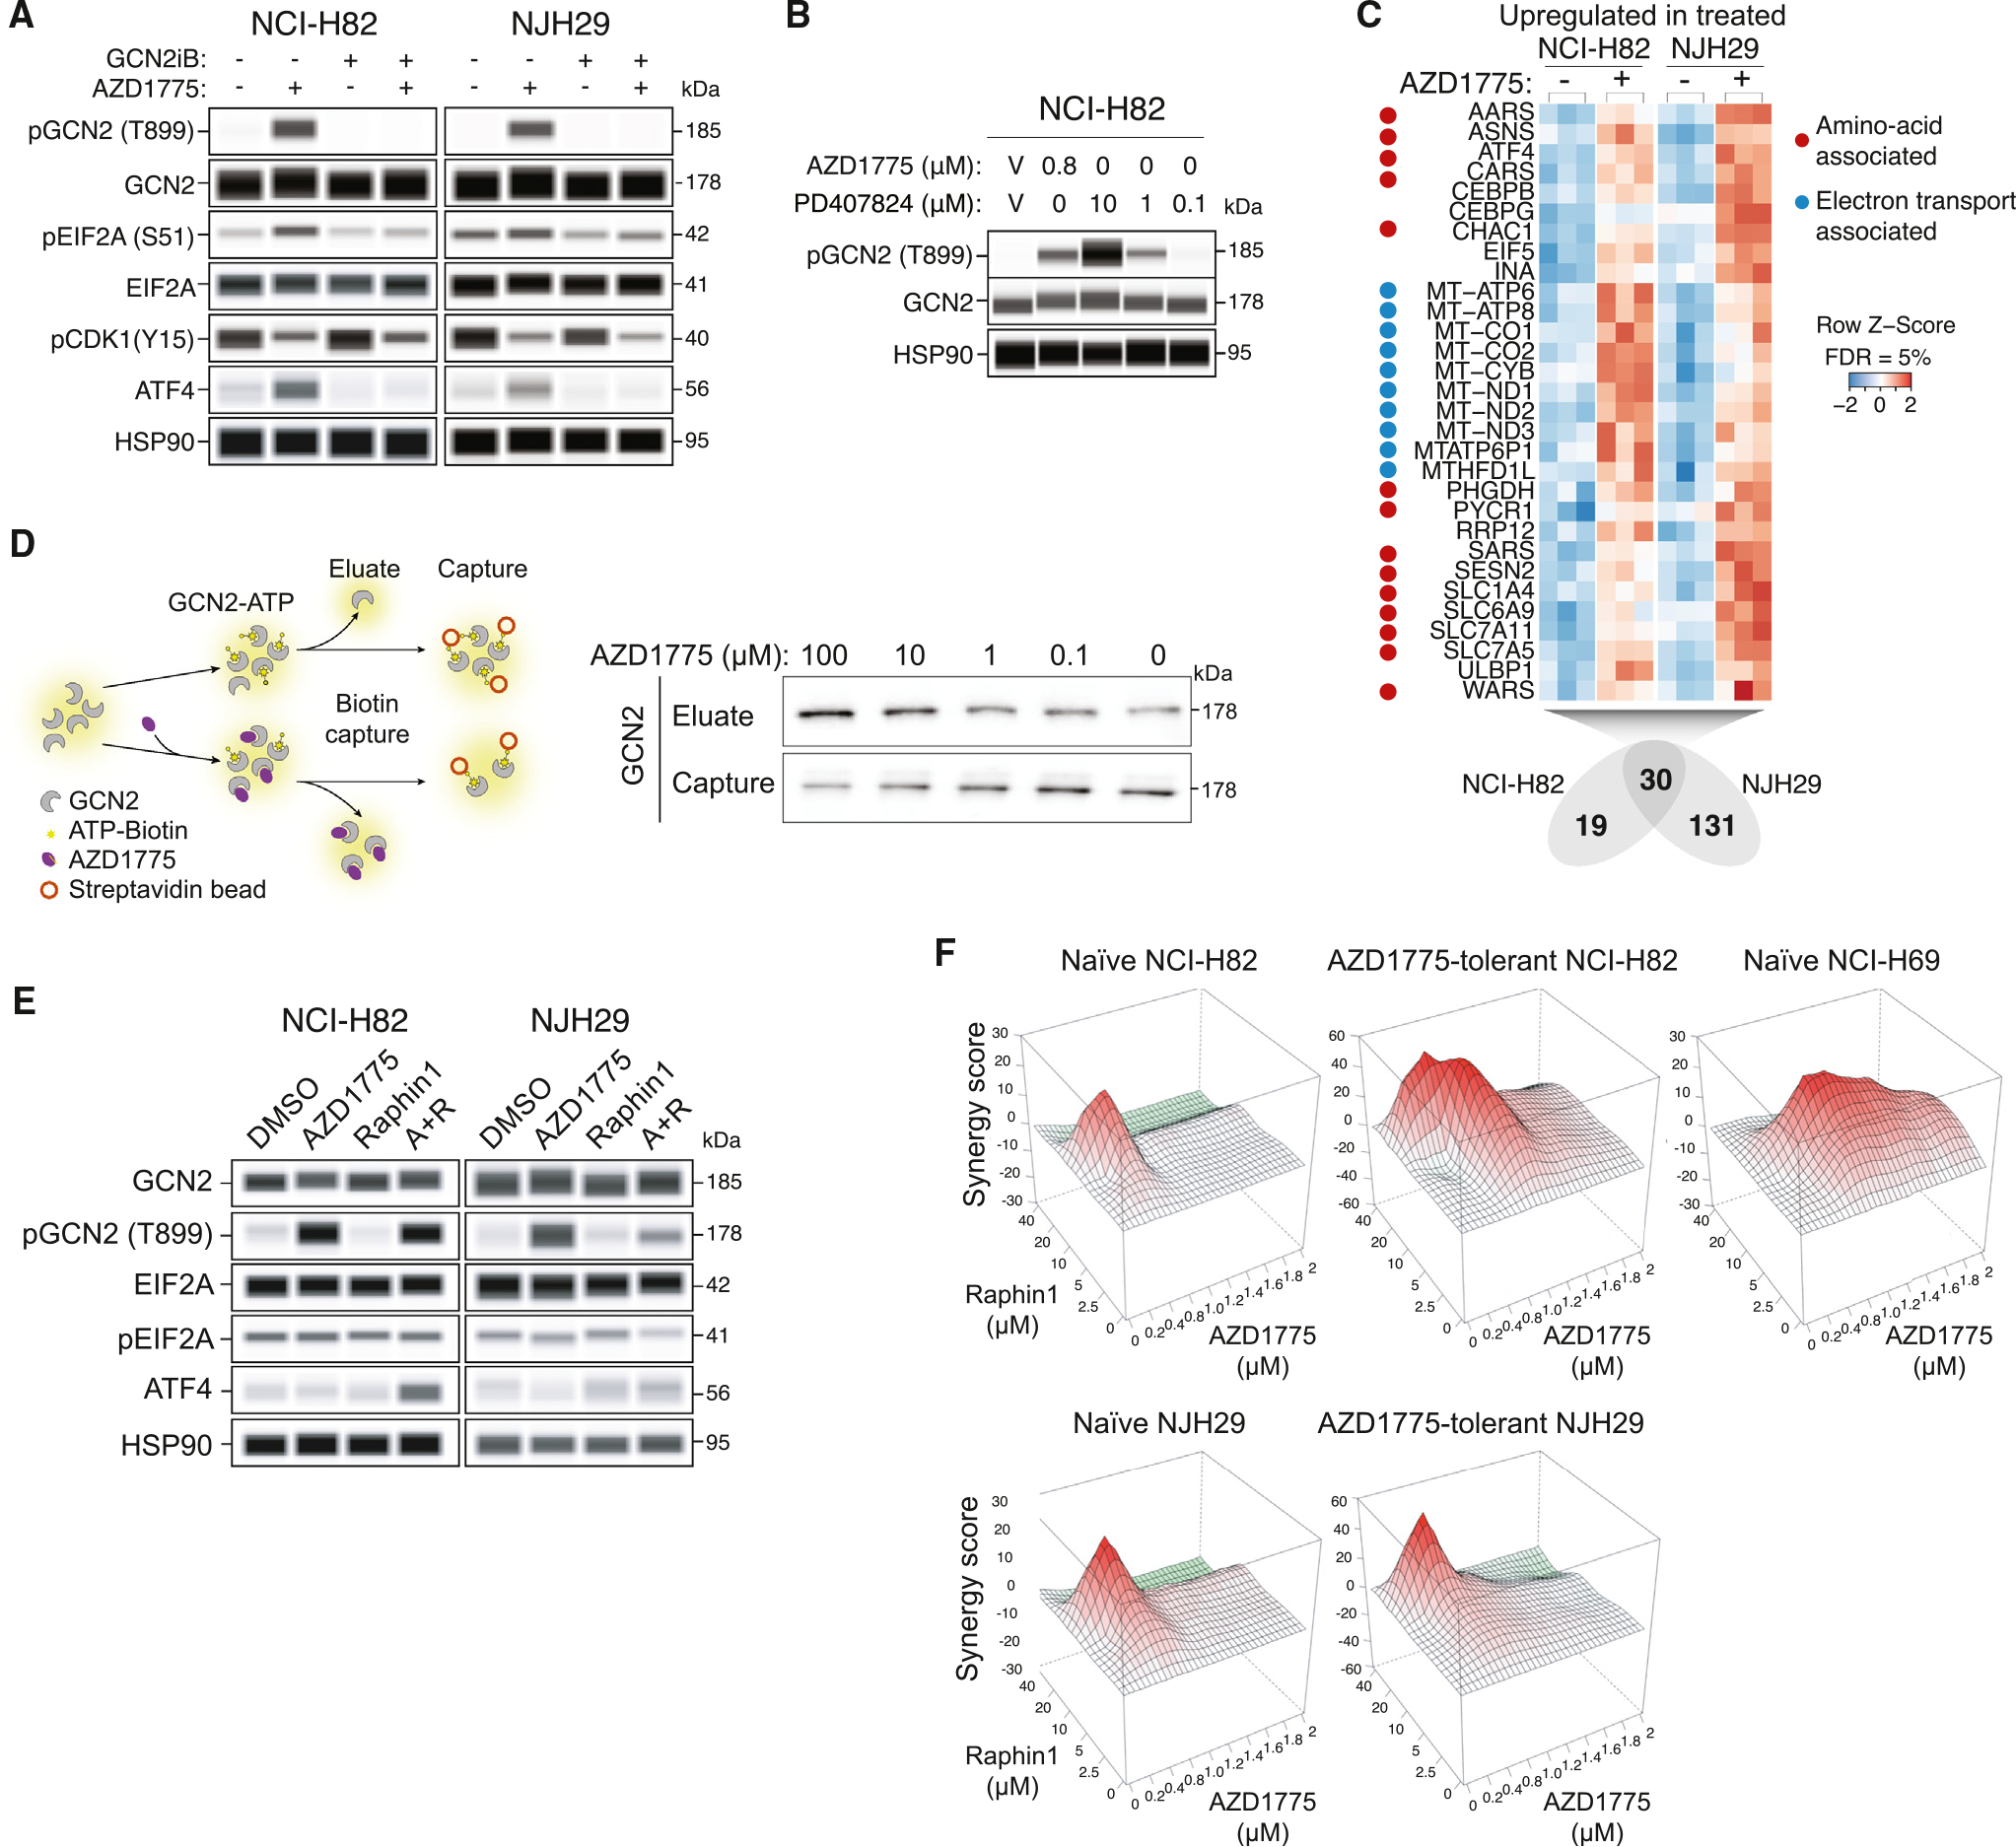
Figure 2. Direct activation of GCN2 by AZD1775 engages a stress response in SCLC cells.

(A) Analysis of the GCN2 pathway by immunoassay after a 1-h treatment with AZD1775 (0.4 μM), the GCN2 inhibitor GCN2iB (1 μM), or both in NCI-H82 (n = 1) and NJH29 cells (n = 1). HSP90 is a loading control.
(B) Immunoassay for GCN2 phosphorylation after a 2-h treatment with the WEE1 inhibitors AZD1775 and PD407824 in NCI-H82 cells (n = 1). HSP90 is a loading control.
(C) Commonly upregulated genes in an RNA-seq analysis of NCI-H82 and NJH29 cells (n = 3 per condition) after a 24-h treatment with AZD1775 (0.4 μM). Heatmaps indicate gene counts in each replicate.
(D) Left: schematic of the biotin capture assay used to evaluate the competition between ATP and AZD1775 with recombinant GCN2. Right: immunoblot for GCN2 on the eluate and captured fractions with different concentrations of AZD1775 (independent replicate in Figure S2J).
(E) Analysis of the GCN2 pathway by immunoassay in NCI-H82 and NJH29 cells (n = 1 per cell line) upon treatment with AZD1775 (0.4 μM), Raphin1 (10 μM), or the combination of both molecules.
(F) Synergy plots from alamarBlue assays in human SCLC cell lines with various doses of AZD1775 (0–2 μM) and Raphin1 (0–40 μM) for 5 days (n = 1).
