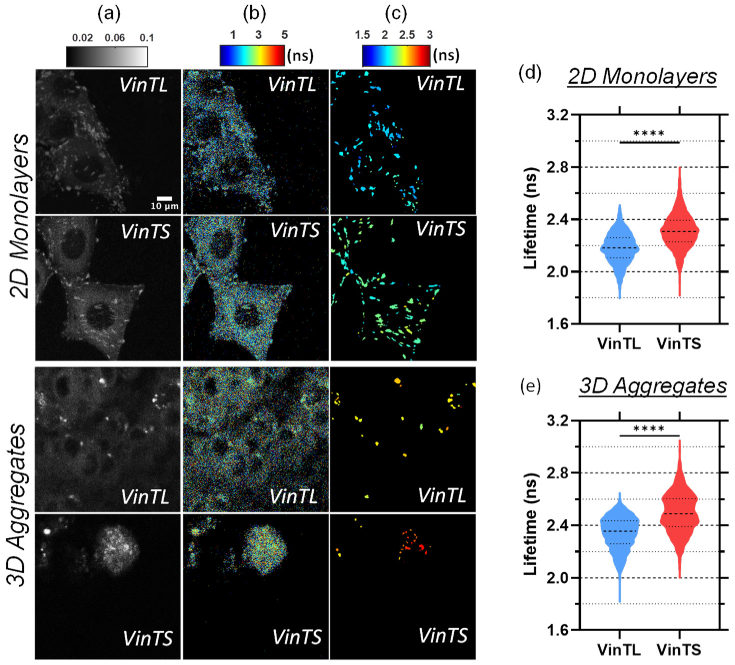
Fig. 3.
Representative images of CHO-K1 cells expressing VinTS or VinTL in 2D monolayers (top panels) and in an optical section of a multicellular aggregate (bottom panels). (a) Donor intensity, (b) corresponding fluorescence lifetime, and (c) processed lifetime images after assigning the intensity-weighted mean lifetime value to each segmented adhesion region. A 3D volume rendering of the multicellular aggregates is presented in Supplement 1 (1.7MB, pdf) . (d) and (e) Violin plots of the intensity-weighted mean lifetime of all adhesions analyzed in the 2D monolayer cultures (d) and the multicellular aggregates (e). The lifetime of VinTS is significantly longer than that of VinTL (**** denotes p < 0.0001 by Mann-Whitney test).

