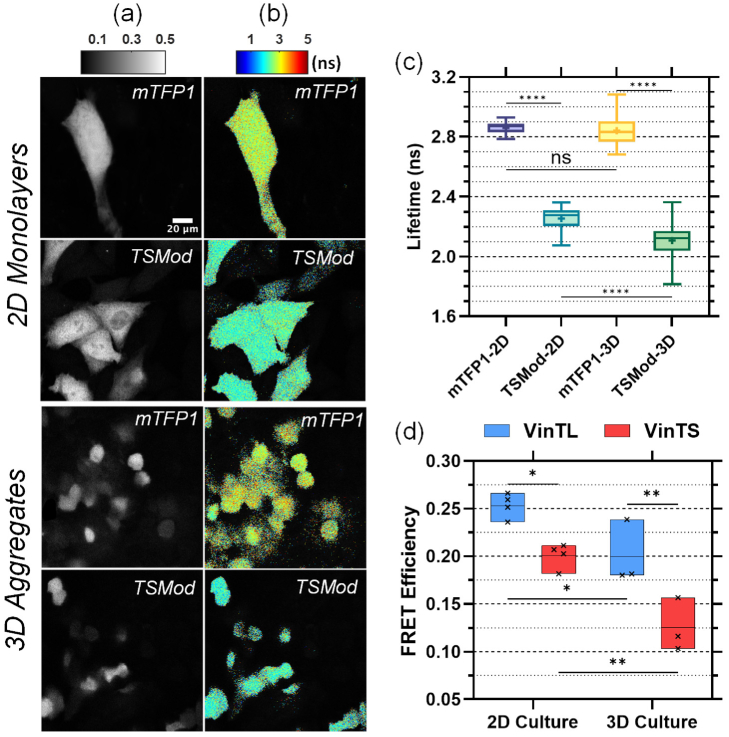
Fig. 5.
Conversion of measured lifetime to FRET efficiency based on mTFP1 and TSMod. Representative donor intensity (a) and lifetime (b) images of mTFP1 and TSMod in 2D monolayers (top panels) and multicellular aggregates (bottom panels). (c) Analysis of intensity-weighted mean lifetime per cell for all mTFP1 and TSMod data. **** denotes p < 0.0001, ‘ns’ (not significant) denotes p > 0.05 (One-way ANOVA followed by Dunn’s post hoc multiple comparisons tests). The boxes length is the interquartile range (IQR) extending from the 25th to th 75th percentile, the line denotes the median, the point the mean, and the whiskers extend to the minimum and maximum value. (d) FRET efficiency of VinTS and VinTL after conversion of the measured phase lifetime to True FRET efficiency (Eqs. 2-4). Each point within the box plot represents a separate experiment. The boxes length extends from the minimum to the maximum value and the line denotes the mean. * denotes p < 0.05; ** p < 0.01 (Two-way ANOVA followed by Tukey's post hoc multiple comparisons test). Results of multi-comparisons statistics tests may be found in Supplement 1 (1.7MB, pdf) .

