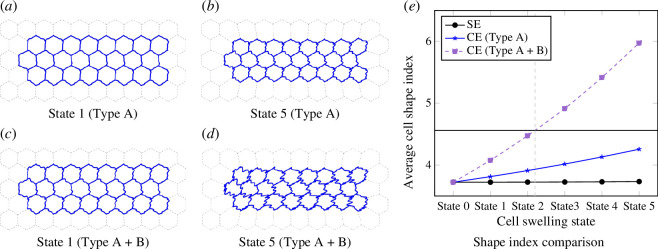
Figure 12.
Simulation results and shape index comparison for an ordered collection of cells. In (a–c) the cell edges show wavy shapes and the cell shape indices are less than , still not significant compared with (d) where the cell shape index is greater than . (e) The black horizontal line represents shape index of the regular triangle. A transition point is represented by the dashed grey vertical line.

