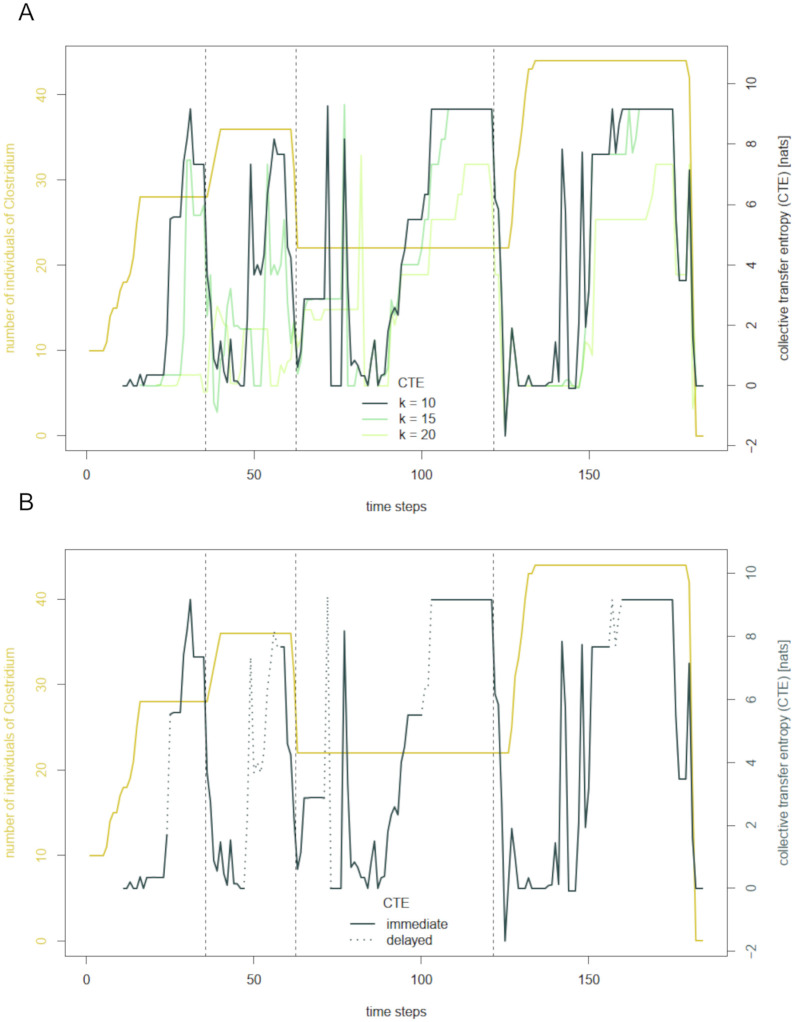
Fig 6. Filtering the collective transfer entropy of Clostridium.
A: Abundance and collective transfer entropy (CTE) of Clostridium with varying history lengths 10, 15, and 20 for a run of the base simulation. Dashed vertical lines mark the feeding events after time steps 35, 62, and 121. B: Filtered collective transfer entropy (CTE) of Clostridium with delayed effects marked by dotted lines.

