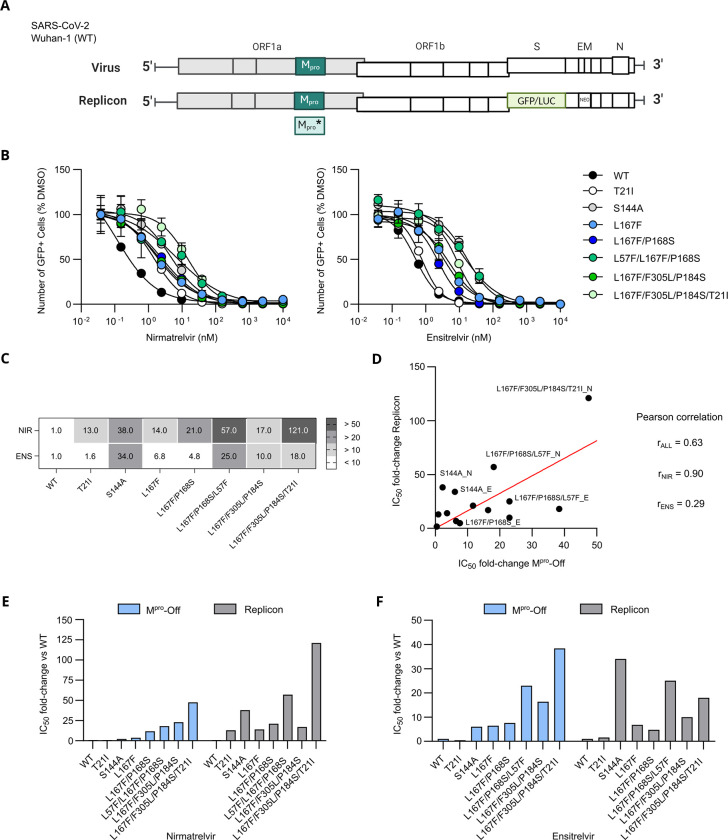
Fig 4.
SARS-CoV-2 replicon dose responses of WT and mutants against nirmatrelvir (A) Schematic view of the SARS-CoV-2 genome and the replicon system that was generated. Spike, E and M genes were exchanged with GFP/LUC and neomycin-resistance gene (NEO) (B) Dose responses experiments of nirmatrelvir (left) and ensitrelvir (right) against Mpro mutants tested with the replicon system. Data is presented as ± SEM of n = 3 biologically independent replicates. (C) SARS-CoV-2 replicon IC50 fold-changes compared to WT. (D) Linear regression analysis of resistance data generated by performing Mpro-Off and SARS-CoV-2 replicon assays. Mpro-Off IC50 fold-changes are plotted on the x-axis and replicon IC50 fold-changes are plotted on the y-axis. Dots are labelled with the variant’s name, followed by either N or E, which stand for nirmatrelvir and ensitrelvir, respectively. Pearson’s correlation coefficients are displayed on the right side of the plot (nirmatrelvir and ensitrelvir grouped: rALL = 0.63; nirmatrelvir only: rNIR = 0.90, ensitrelvir only: rENS = 0.29). A strong correlation was found for nirmatrelvir, whereas a low correlation was seen for ensitrelvir. Overall, the two systems have a moderate/high correlation. (E) Bar plot of the comparison between the Mpro-Off assay and replicon resistance phenotypes (IC50 fold changes) of nirmatrelvir (F). Bar plot of the comparison between the Mpro-Off assay and replicon resistance phenotypes (IC50 fold changes) of ensitrelvir.

