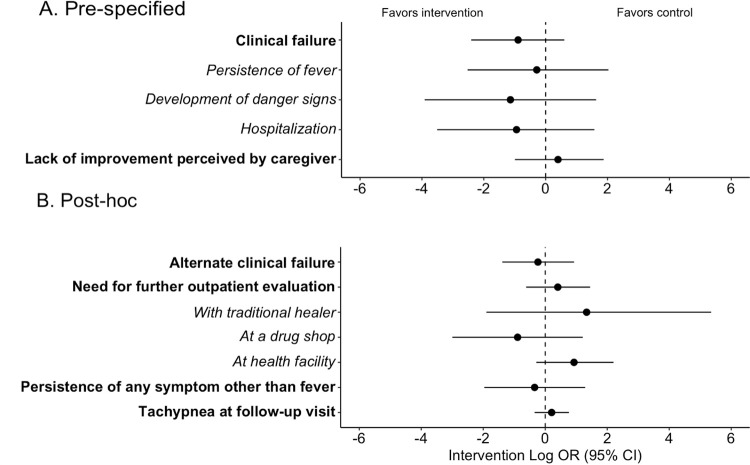
Fig 4. Forest plot of secondary outcomes.
(A) Prespecified secondary outcomes. (B) Post hoc secondary outcomes. Odds ratios presented on the log scale with point estimates shown by circles and 95% confidence intervals shown by error bars. (Non-transformed ORs with 95% CIs and p-values are detailed in S5 Table.) Dashed line indicates null value. Individual components of composite outcomes indicated with italic text below the corresponding composite outcome.

