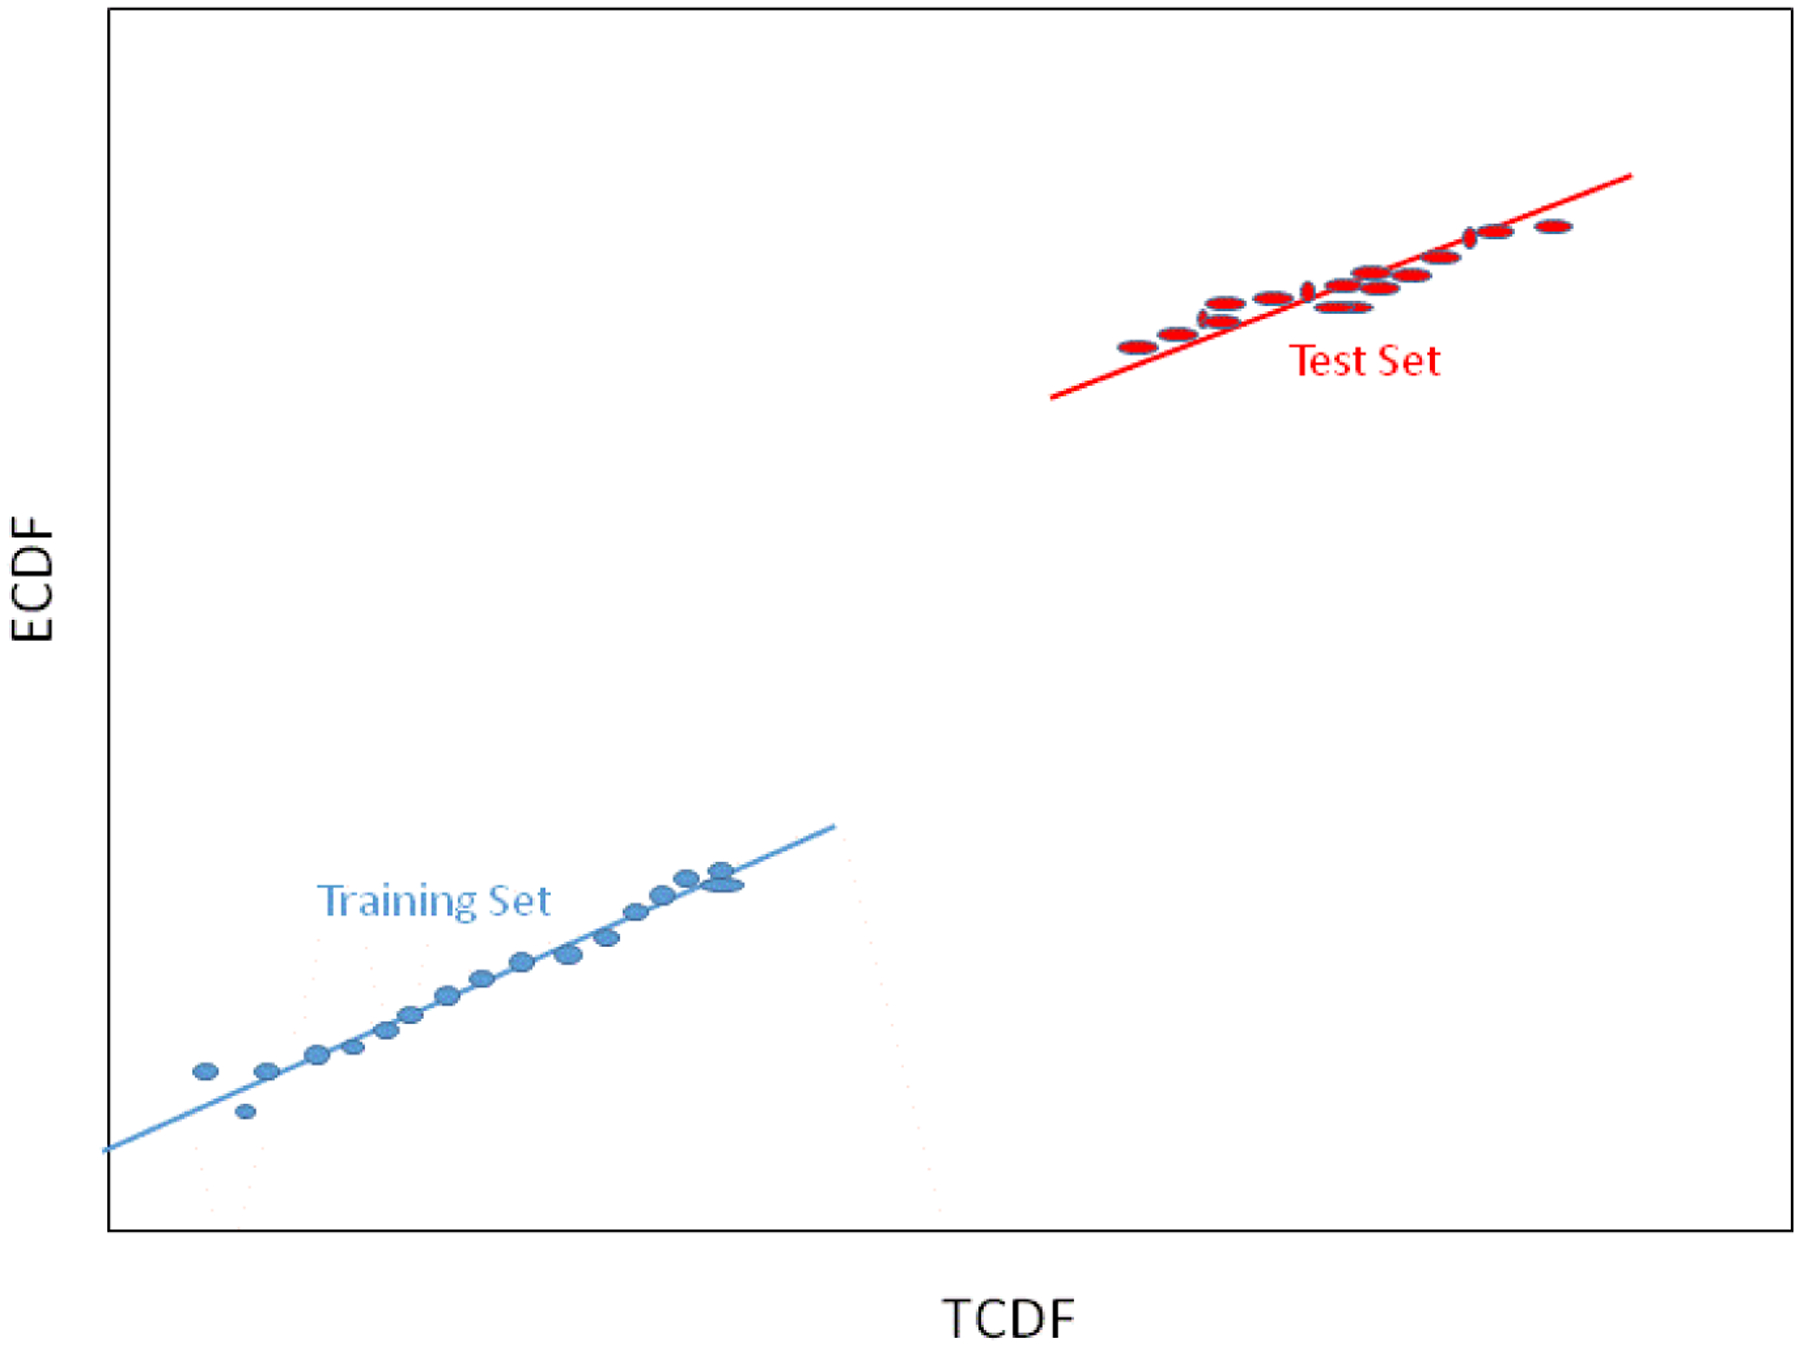
Figure 11.

QQ Plot. A correlation coefficient calculated for the QQ plot gives an indication of how well the two distributions (training set and test set) match. A correlation coefficient of r=1 indicates matching distributions. A 98% confidence limit on r is typically used to detect a match. If a measured r is greater than the 98% limit, the two distributions are said to match.
