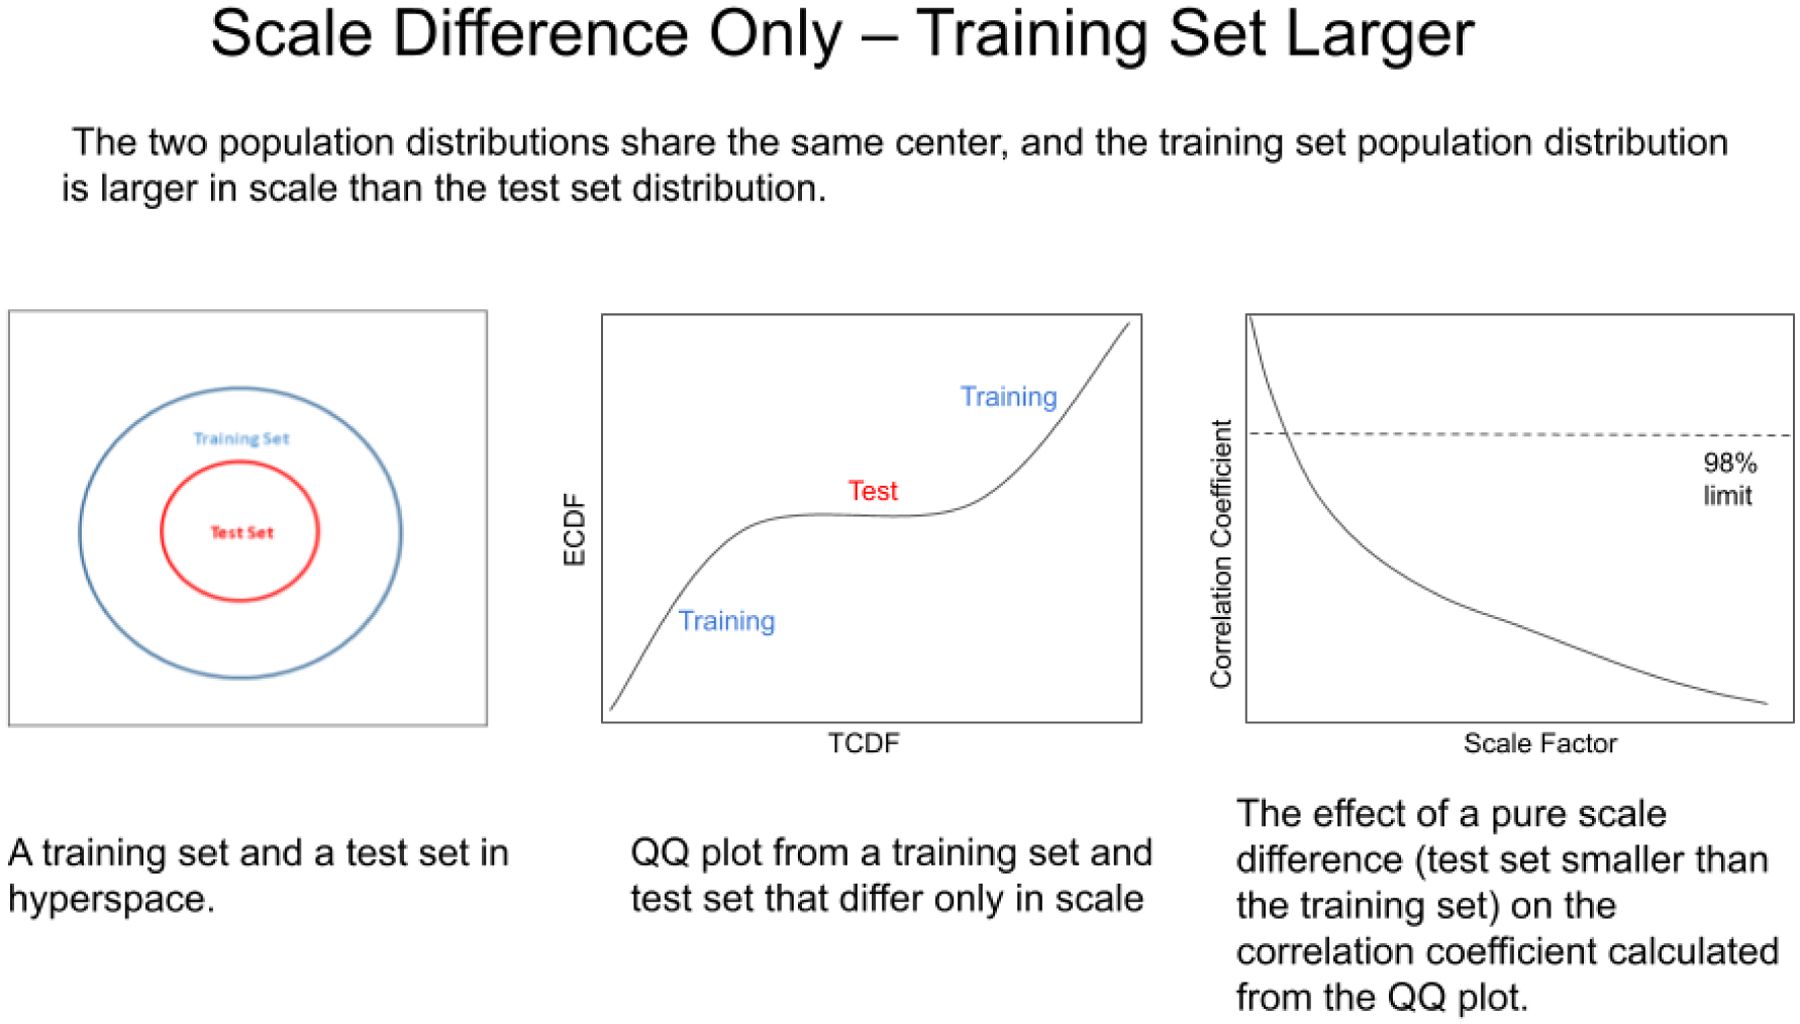
Figure 13.

The effects of a pure scale difference on the correlation coefficient calculated from a QQ plot. The scale represents the spectral variability. In this instance the test set spectra are more reproducible than the training set spectra.

The effects of a pure scale difference on the correlation coefficient calculated from a QQ plot. The scale represents the spectral variability. In this instance the test set spectra are more reproducible than the training set spectra.