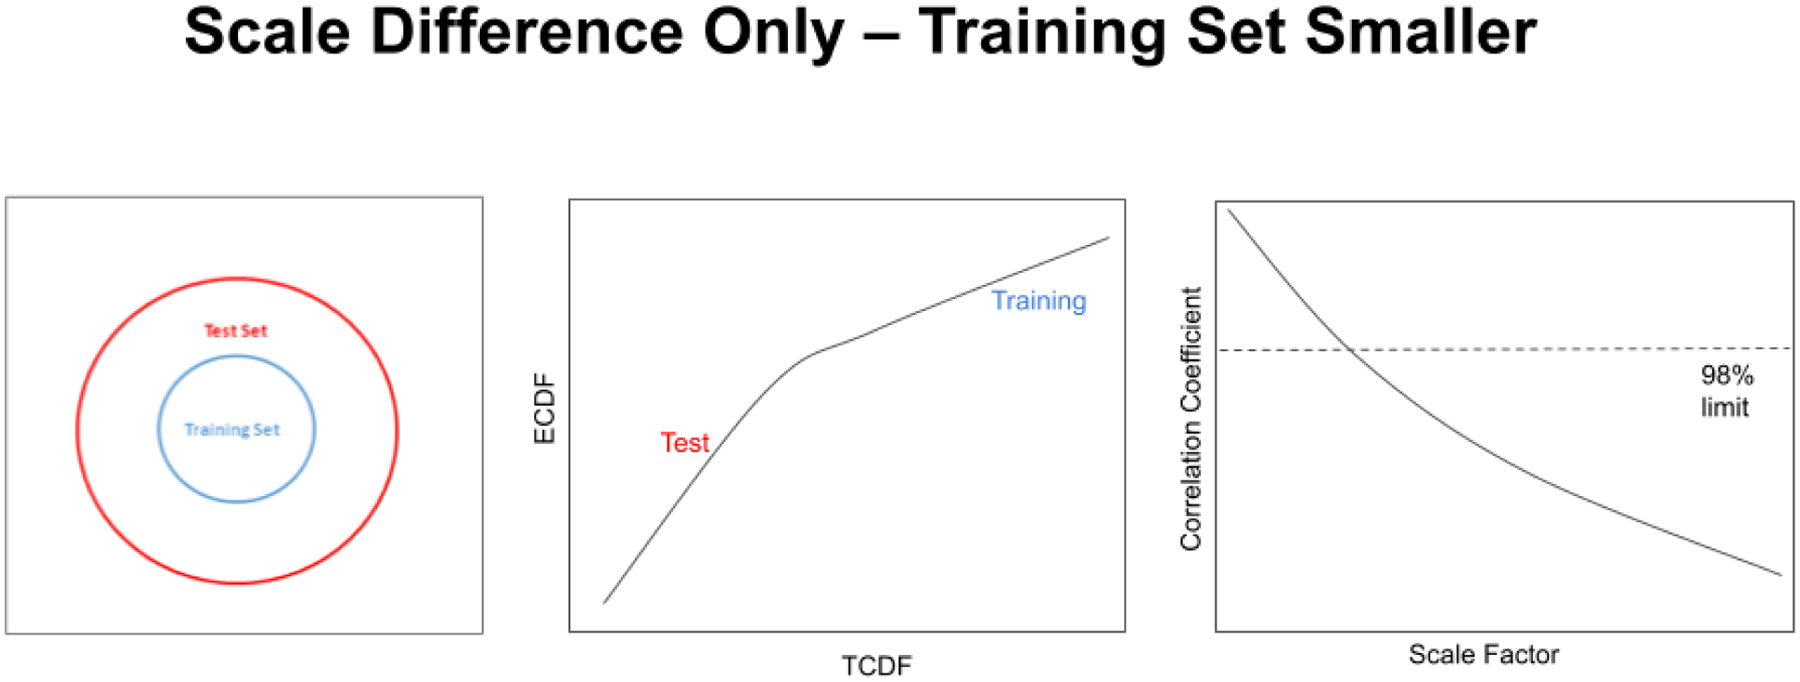
Figure 14.

A QQ plot from the subcluster detection method corresponding to the pure scale difference situation. The test set is larger in scale than the training set (left), and a test set forms the lower line with the larger slope in the figure (center). The bend in the line is slight because the difference between the two set scales is only a factor of 2.5. As the training set shrinks in scale relative to the test set, the slope of the training set segment is reduced and the correlation coefficient through the QQ plot falls (right). The scale factor is the multiplier by which the test set is larger than the training set.
