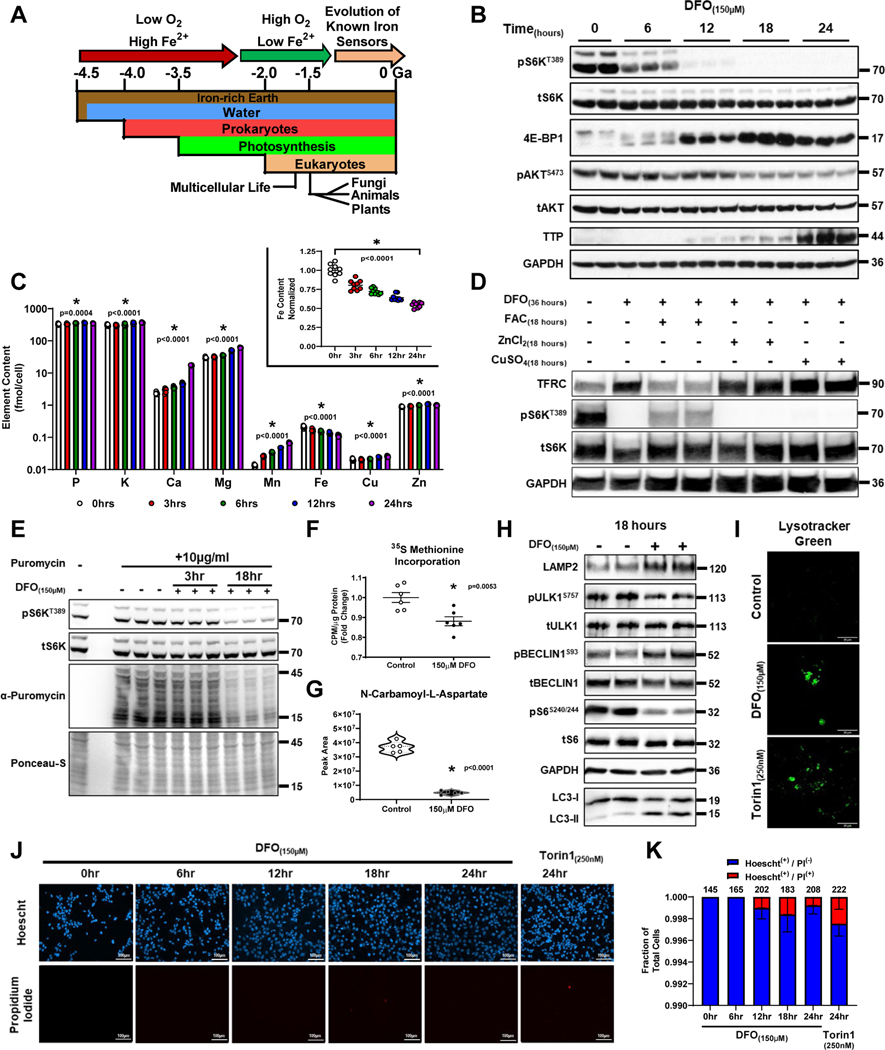
Figure 1. Long-term ID inactivates mTORC1.
(A) Schematic of the evolution of eukaryotic life on earth2,3. (B) Immunoblot of mTORC1 and mTORC2 activity in HEK293T cells treated with 150μM DFO for the indicated times. Representative image of two independent experiments. (C) ICP-MS-based measurement of cellular metal content plotted on Log10-scale in HEK293T cells treated with 150μM DFO for the indicated times. Insert graph depicts normalized changes in Fe content plotted on a linear scale. (n=3 independent samples measured in triplicate, one-way ANOVA and Tukey’s post-hoc test, mean ± SE). (D) Immunoblot of mTORC1 activity in HEK293T cells treated with 150μM DFO for 18 hours and then supplemented with equimolar concentrations of either Fe2+, Cu2+ or Zn2+ for an additional 18 hours. Representative image of two independent experiments. (E-F) Incorporation of puromycin (E) and 35S methionine (F) into elongating peptide chains in HEK293T cells after treatment with 150μM DFO for 18 hours. ((F) n=6 replicates per condition, two-tailed unpaired t-test, mean ± SE). (G) Cellular levels of N-carbomyl-L-aspartate after treatment with 150μM DFO for 18 hours measured by HPLC-MS (n=5 replicates per condition, two-tailed unpaired t-test, median ± quartiles). (H) Assessment of autophagy, as measured by ULK1 phosphorylation, LAMP2 levels and BECLIN1S93 phosphorylation, and conversion of LC3I to LC3II in HEK293T cells treated with 150μM DFO for 18 hours. Representative image of two independent experiments. (I) Fluorescent confocal microscopy of lysosomes stained with Lysotracker green in HEK293T cells treated with 150μM DFO for 18 hours or 250nM Torin1 for 6 hours. Representative image of five independent samples. (J) Fluorescent microscopy of cell death using Hoescht and propidium iodide (PI) double staining in HEK293T cells treated with 150μM DFO or 250nM Torin-1 at indicated times. Representative image of five independent samples. (K) Quantification of images in panel J. (n=6 replicates, one-way ANOVA and Tukey’s post-hoc test, mean ± SE). Source numerical data and unprocessed blots are available in source data files. * indicates P value < 0.05 when noted for all panels.

