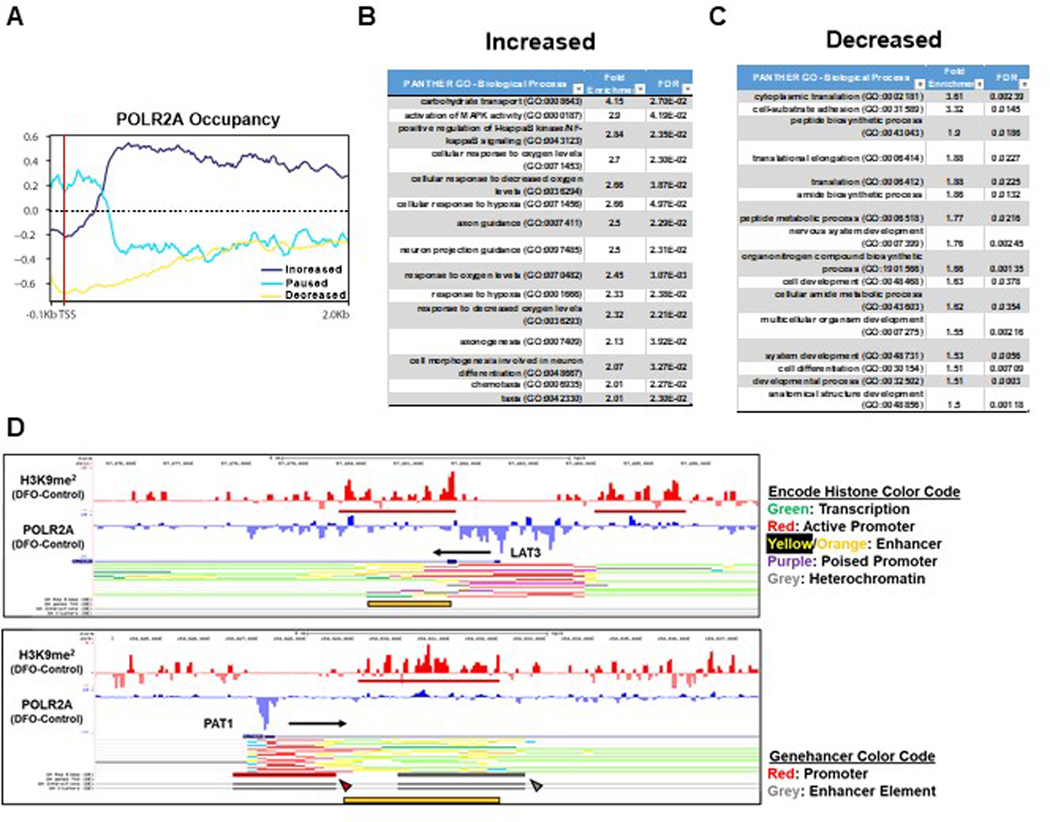
Extended Data Figure 5. ID alters occupancy of POLR2A at the promoters of genes involved in metabolic pathways.
(A) Fold change in POLR2A occupancy within predefined regions of the promoter and gene body to categorize genes defined by increased POLR2A binding, POLR2A loss, and promoter-pausing. (B) Gene-ontology (GO) terms of genes enriched in the increased POLR2A group after ID. (C) GO terms of genes that had decreased POLR2A after ID. (D) UCSC genome browser tracks for the LAT3 (top) and PAT1 (bottom) gene loci. POLR2A and H3K9me2 tracks from ChIP-seq analysis were loaded and represented as the difference in normalized reads between the DFO and control groups. Regions of H3K9me2 enrichment in the DFO group are underlined in red. Direction of transcription is indicated by a black arrow. Encode Histone (LAT3 and PAT1) and Genehancer (PAT1) browser tracks are displayed beneath and represent predicted enhancer regions which align with regions of increased H3K9me2 signal in response to DFO. Yellow bar, red and grey arrows indicate enhancer regions designated by Encode Histone and Genehancer browser tracks.

