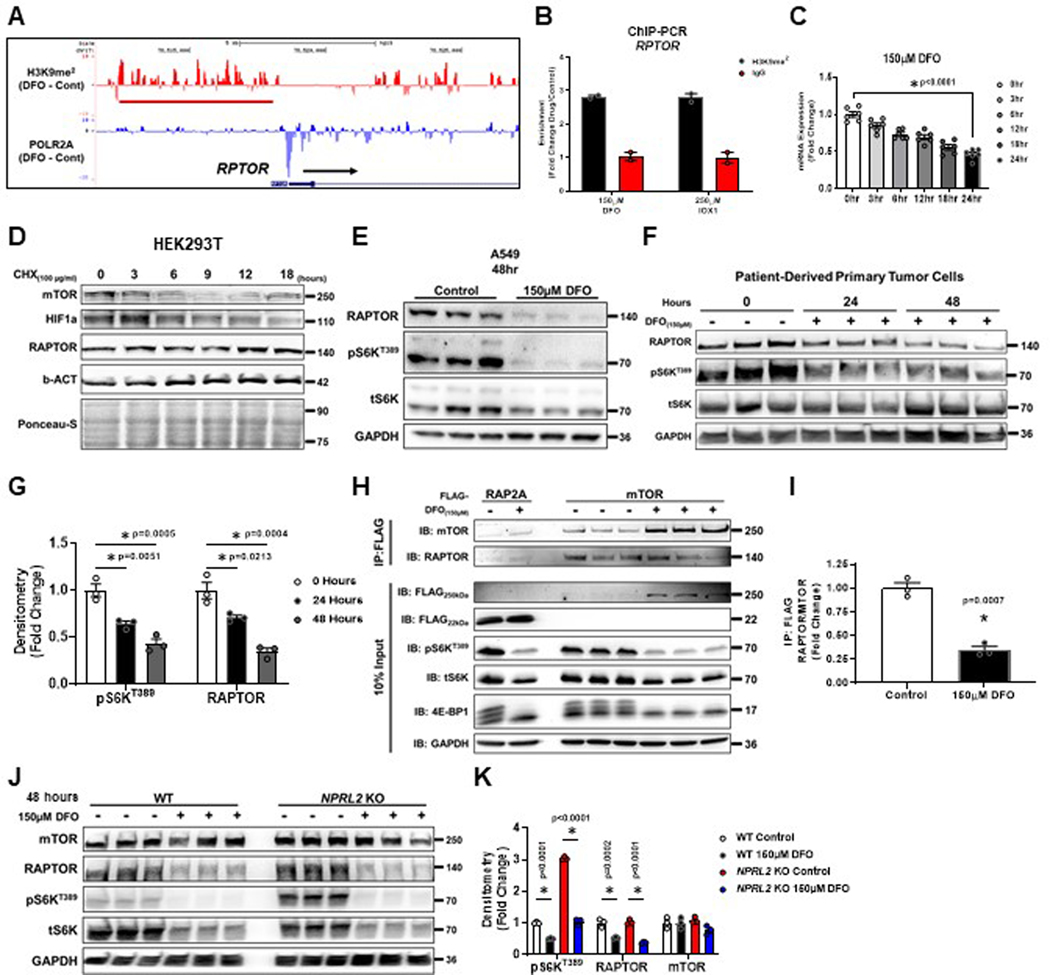
Extended Data Figure 6. ID increases H3K9 di-methylation within the promoter of RPTOR and correlates with decreased RPTOR expression.
(A) H3K9me2 signal and POL2RA occupancy in the promoter for RPTOR from ChIP-Seq analysis. (B) ChIP-PCR of RPTOR in HEK293T cells. Cells treated with 150μM DFO or 250μM IOX1 for 12 hours and vehicle controls were followed by IP of lysates using an antibody against H3K9me2. IgG was used as a negative control for the IP (n=2 replicates). (C) RPTOR mRNA levels at indicated time points after the addition of 150μM DFO. Samples matched with Figure 4I. Internal control: POLR2A (n=4 replicates per condition, one-way ANOVA and Tukey’s post-hoc test, mean ± SE). (D) Immunoblot of RPTOR, mTOR and HIF1-α levels in HEK293T cells treated with 100 μg/ml cycloheximide (CHX) for indicated time points. HIF1-α, which is rapidly turned over under normoxic conditions via the actions of the EGLN and Von-Hippel Lindau (VHL) proteins, was used as a positive control. Representative image of one experiment. (E) Immunoblot of mTORC1 activity and complex member RAPTOR in A549 cells after treatment with 150μM DFO for 48 hours. Representative image of two independent experiments. (F) Immunoblot of mTORC1 activity and complex member RAPTOR in patient-derived primary tumor cell cultures treated with 150μM DFO. Representative image of one experiment. (G) Quantification of immunoblot in panel (F) (n=3 replicates, one-way ANOVA and Tukey’s post-hoc test, mean ± SE.) (H) Immunoblot of lysates from cells transfected with FLAG-RAP2A or FLAG-mTOR and treated with or without 150μM DFO for 48 hours. Immunoprecipitation was performed with anti-FLAG antibody. RAP2A = negative control. (I) Summary of IP studies from panel (H) (n=3 replicates, two-way unpaired t-test, mean ± SE). Representative image of two independent experiments (J) Immunoblot of mTORC1 activity in WT and NPRL2 KO HEK293T treated with and without 150μM DFO for 48 hours. Representative image of one experiment. (K) Quantification of immunoblot in panel (J) (n=3 replicates, one-way ANOVA and Tukey’s post-hoc test, mean ± SE). * indicates P value < 0.05 when noted for all panels.

