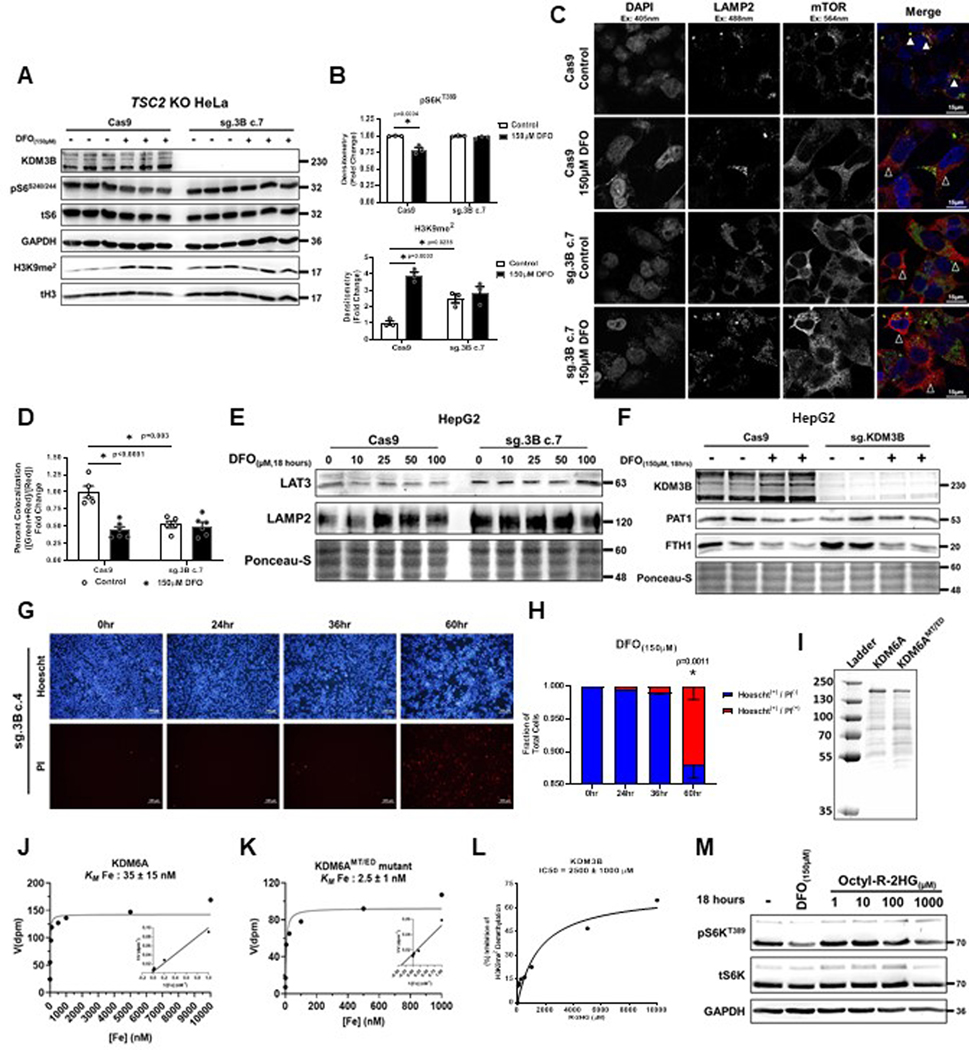
Extended Data Figure 9. KDM3B KO cells do not repress LAT3/PAT1 expression or mTORC1 activity, and have increased cell death during ID.
(A) Immunoblot of mTORC1 activity and H3K9me2 in Cas9 (WT) and sg.3B c.7 (KDM3B KO) TSC2 KO HeLa cells in the presence and absence of 150μM DFO for 18 hours. Representative image of one experiment. (B) Summary of immunoblot in panel A (n=3 replicates per group, one-way ANOVA with Tukey’s post-hoc test. Mean ± SE). (C) Assessment of mTORC1 on the lysosome in KDM3B KO HepG2 cells treated with 150μM DFO for 18 hours. Representative image of five independent samples. (D) Quantification of images in panel C. (n=5 replicates per condition, one-way ANOVA and Tukey’s post-hoc test, mean ± SE). (E) Immunoblot of LAT3 protein in KDM3B KO HepG2 cells treated with DFO for 18 hours. Representative image of one experiment. (F) Immunoblot of PAT1 protein in KDM3B KO HepG2 cells treated with DFO for 18 hours. Representative image of one experiment. (G) Fluorescent microscopy of cell death using Hoescht and propidium iodide (PI) double staining in KDM3B KO HEK293T cells treated with 150μM DFO for 0, 24, 36 and 60 hours. Representative image of six independent samples. (H) Quantification of images in panel G. (n=6 replicates, one-way ANOVA and Tukey’s post-hoc test, mean ± SE). (I) SDS-PAGE gel of purified N-terminal FLAG-tagged WT KDM6A and KDM6AMT/ED mutant expressed using a baculoviral overexpression system. Representative image of three independent experiments. (J, K) Enzyme kinetics of WT KDM6A (J) and KDM6AMT/ED (K) in the presence of increasing concentrations of iron. (L) Enzyme kinetics of KDM3B in the presence of increasing concentrations of R-2HG. (M) Immunoblot of mTORC1 activity in HEK293T cells after treatment with 150μM DFO or increasing concentrations of octyl-R-2HG. Representative image of one experiment. * indicates P value < 0.05 when noted for all panels.

