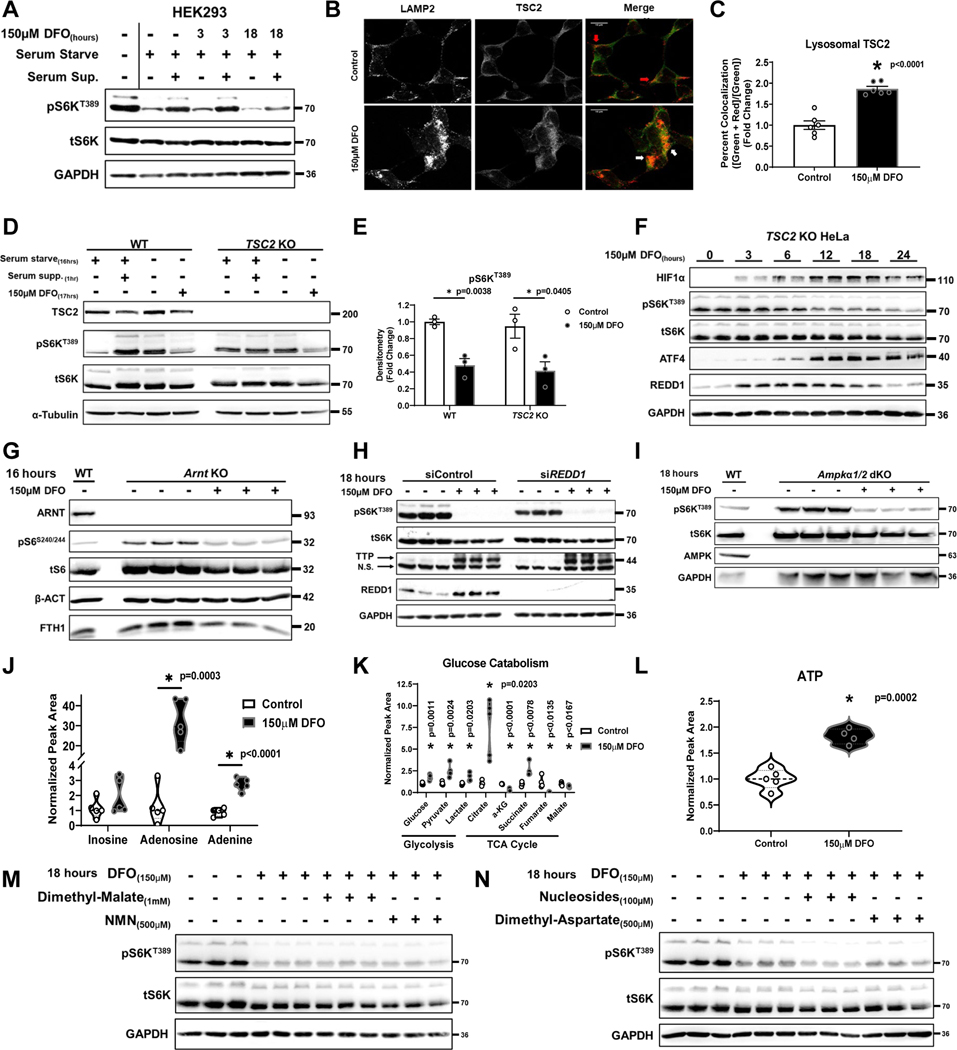
Figure 2. ID does not require TSC1/2 or AMPK signaling to inhibit mTORC1.
(A) Immunoblot of mTORC1 activity in HEK293 cells that were serum starved overnight followed by the addition of serum for 1 hour in the presence or absence of 150μM DFO for the indicated times. Representative image of three independent experiments. (B) Recruitment of TSC2 to the lysosome in HEK293 cells treated with DFO for 24 hours. Representative image of five independent samples. (C) Summary of the results in panel C (n=6 replicates per condition, two-tailed unpaired t-test, mean ± SE). (D) Immunoblot of mTORC1 activity in WT and TSC2 KO HeLa cells that were serum starved overnight followed by the addition of serum for 1 hour in the presence or absence of 150μM DFO for 17 hours. Representative image of two independent experiments. (E) Summary graph of immunoblot in panel D (n=3 samples per condition, one-way ANOVA and Tukey’s post-hoc test, mean ± SE). (F) Immunoblot of mTORC1 activity and hypoxia regulated factors in TSC2 KO HeLa cells treated with 150μM DFO for the indicated times. Representative image of two independent experiments. (G) Immunoblot of mTORC1 activity in Arnt KO MEFs treated with 150μM DFO for 16 hours. Representative image of two independent experiments. (H) Immunoblot of mTORC1 activity in HEK293T cells treated with REDD1 siRNA in the presence and absence of 150μM DFO for 18 hours. Representative image of one experiment with 3 independent samples. (I) Immunoblot of mTORC1 activity in WT and Ampkα 1/2 dKO MEFs treated with 150μM DFO for 18 hours. Representative image of two independent experiments. (J) Cellular levels of the purines inosine, adenosine, and adenine in HEK293T cells after treatment with 150μM DFO for 18 hours measured by HPLC-MS (n=5 replicates per condition, two-tailed unpaired t-test, median ± quartiles). (K) Targeted metabolomics in HEK293T cells treated with 150μM DFO for 18 hours (n=4 replicates per condition, two-tailed unpaired t-test, median ± quartiles). (L) Total cellular ATP pools in HEK293T cells after 18 hours of treatment with 150μM DFO (n=4 replicates per condition, two-tailed unpaired t-test, median ± quartiles). (M) Immunoblot of mTORC1 activity in HEK293T cells in the presence and absence of 150μM DFO for 18 hours, supplemented with 1mM dimethyl malate or 500μM NMN. Representative image of one experiment with 3 independent samples. (N) Immunoblot of mTORC1 activity in HEK293T cells in the presence and absence of 150μM DFO for 18 hours, supplemented with 100μM nucleoside cocktail (Adenosine, Guanosine, Thymidine and Cytidine), or 500μM dimethyl aspartate. Representative image of one experiment with three independent samples. Source numerical data and unprocessed blots are available in source data files. * indicates P value < 0.05 when noted for all panels.

