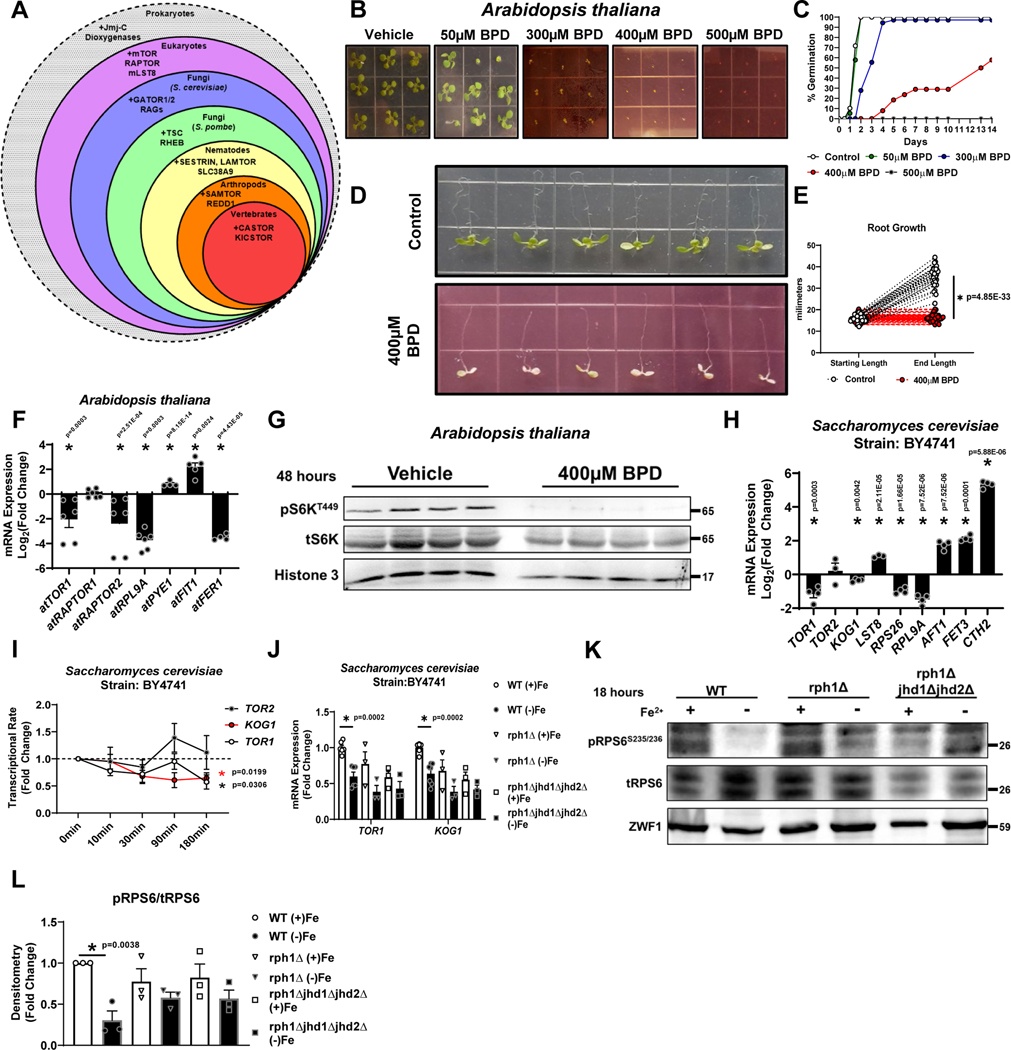
Figure 7. ID leads to epigenetic repression of core mTORC1 genes in Arabidopsis thaliana and Saccharomyces cerevisiae.
(A) Schematic of conservation of mTOR components and its regulatory proteins among various species. (B) Representative images of post-germination growth of A. thaliana seeds germinating on MS medium containing indicated concentrations of BPD (14 days after stratification) from three independent experiments. (C) Summary graph of seed germination rates in panel B. Representative data from three independent experiments. (D) A. thaliana root growth on MS medium containing 0 (Control) or 400μM BPD for 4 days. Seedlings were transferred 5 days after stratification on BPD-free MS medium. (E) Summary bar graph of root length in panel (D) (n=30 replicates control; n=24 BPD, two-tailed unpaired t-test, mean ± SE). (F) mRNA expression of indicated TOR components and markers of ID and TOR activity in A. thaliana seedlings after treatment with 400μM BPD. Internal control: At ACTIN2 (n=6 replicates for all groups except n=4 for atPYE1 and atFER1, unpaired t-test, mean ± SE). A. thaliana seedlings were transferred at 5 days after stratification on MS medium to MS medium supplemented with or without BPD. Samples were collected 4 days post-transfer. (G) Immunoblot of A. thaliana TOR activity in seedlings treated with 400μM BPD for 48 hours. Representative image of one experiment. (H) mRNA expression of indicated TOR components and markers of ID in S. cerevisiae cells cultured in Fe dropout media containing 100μM BPS for 18 hours. Internal control: ScACT1 (n=4 replicates for all groups except n=3 for TOR2 and LST8, two-tailed unpaired t-test, mean ± SE). (I) Transcriptional rate of TOR1, TOR2 and KOG1 within 180 minutes of iron chelation in S. cerevisiae (n=3 replicates per condition, one-way ANOVA and Tukey’s post-hoc test, mean ± SE, (black *) = P < 0.05 for TOR1, (red *) = P < 0.05 for KOG1). (J) mRNA expression of TOR1 and KOG1 in WT, ΔRph1 and ΔRph1/ΔJhd1/ΔJhd2 S. cerevisiae cells cultured in Fe dropout media containing 100μM BPS for 18 hours. Internal control: Sc ACT1 (n=6 replicates per condition for WT; n=3 ΔRph1 and n=3 ΔRph1/ΔJhd1/ΔJhd2, one-way ANOVA and Tukey’s post-hoc test, mean ± SE). (J) Immunoblot of TOR activity in WT, Δrph1, and Δrph1Δjhd1Δjhd2 cells cultured in Fe dropout media containing 100μM BPS for 18 hours. Representative image of three independent experiments. (L) Summary bar graph of image in panel K (n=3 replicates per condition, one-way ANOVA and Tukey’s post-hoc test, mean ± SE). Source numerical data and unprocessed blots are available in source data files. * indicates P value < 0.05 when noted for all panels.

