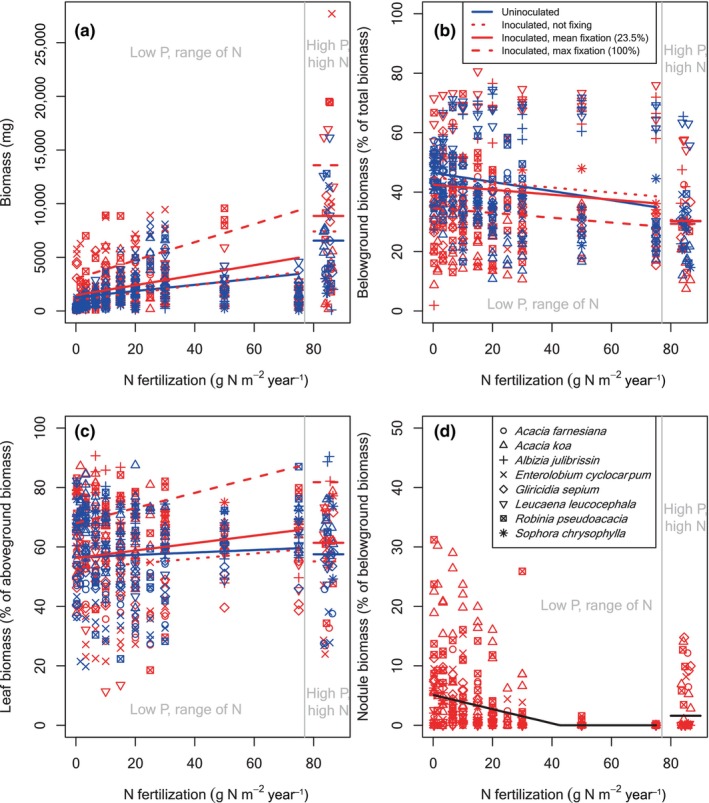
FIGURE 1.

Biomass and biomass allocation across an N fertilization gradient for plants grown at Barnard. (a) Total biomass, (b) the fraction of biomass allocated belowground, (c) the fraction of aboveground biomass allocated to leaves, and (d) the fraction of belowground biomass allocated to nodules, each as a function of N fertilization. High P fertilization points, which have the same N fertilization level as the highest N fertilization points to the left of the gray line, are shown to the right of the gray line. Allocation to nodules is only shown for inoculated plants, as any uninoculated plants that grew nodules were excluded from the analysis. Legends shown in (b) and (d) apply to all panels. As the legend shows, different species are shown as different symbols. Blue symbols are uninoculated; red symbols are inoculated. Each symbol is one individual plant. Lines are the fixed effects from the mixed effects model, evaluated at the average plant biomass for each group (uninoculated vs. inoculated, low vs. high P). For uninoculated fits, both “I” and “%N dfa ” are set to 0. For inoculated fits, “I” is set to 1, and three fits are shown, corresponding to three values of N fixation: 0 %Ndfa, the mean %Ndfa within each greenhouse, and 100% Ndfa. Blue and red colors on lines correspond to the points. The fit in (d) is shown in black instead of red to make it easier to see.
