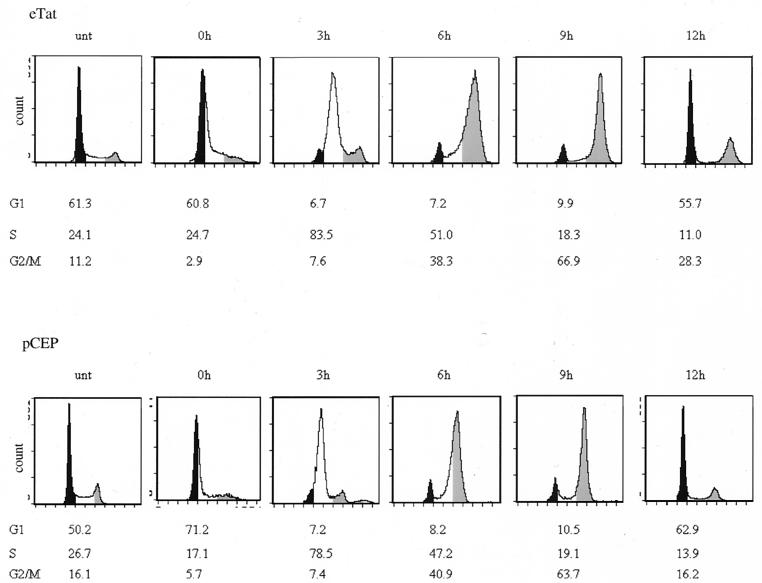
FIG. 1.
Cell cycle analysis of eTat and control pCEP cell lines following Hu block. Log-phase growing cells were blocked with Hu (2 mM) for 18 h and released by removing the inhibitor and adding fresh media. Samples were collected every 3 h, and the cells were processed for FACS analysis. Cells were removed from media at each time point, washed with PBS without Mg2+ or Ca2+, fixed with 70% ethanol, and stained with propidium iodide (Fast Systems, Inc.), followed by cell sorting analysis on a Coulter EPICS cell analyzer. The proportion of cells in G1, S, or G2/M are plotted as the percentage of total cells at each time point. The black sections represent the G1-phase population, the white sections are the S-phase population, and the gray sections represent the G2/M population. The shading on the figures was added manually. The results are representative of three different experiments.

