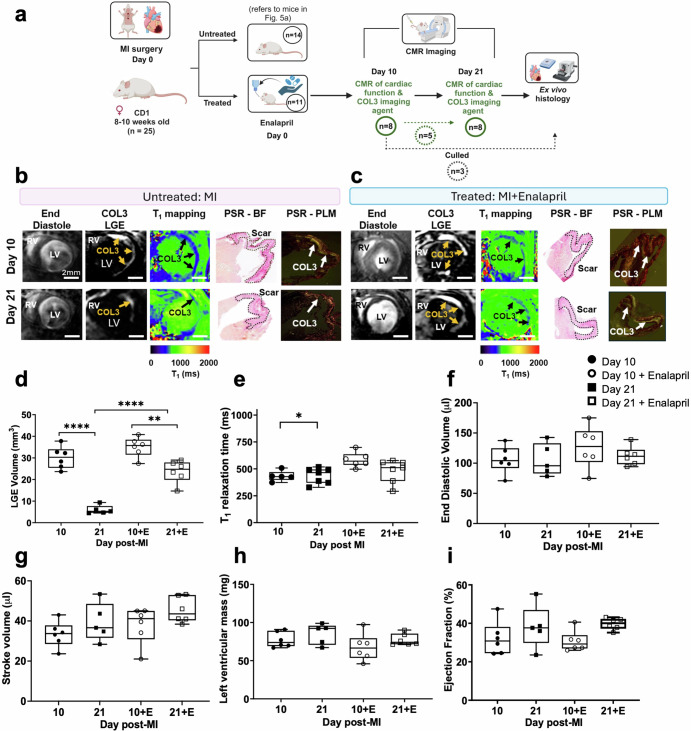
Fig. 6. Molecular imaging of COL3 detects changes after enalapril treatment.
a Experimental design. b, c At day 10, enalapril-treated mice show similar MRI signal enhancement and T1 relaxation times compared to untreated mice. At day 21, enalapril-treated mice show a significantly higher signal enhancement and reduced T1 relaxation values (blue colour) compared with untreated. d, e Quantification of LGE volume shows significantly higher COL3 remodelling in enalapril-treated mice compared with untreated mice at day 21. Quantification of gadolinium uptake showed higher T1 (lower gadolinium concentration) at day 21 compared with day 10 in untreated animals but similar values in enalapril-treated mice. f–i Cine MRI shows no significant changes in cardiac function between groups. LGE late gadolinium enhancement, and *P = 0.0233, **P = 0.0018, and ****P < 0.0001. RV right ventricle, LV left ventricle, PSR Picrosirius Red, BF bright field, PLM polarised light microscopy. Figure 6a was created with BioRender.com.

