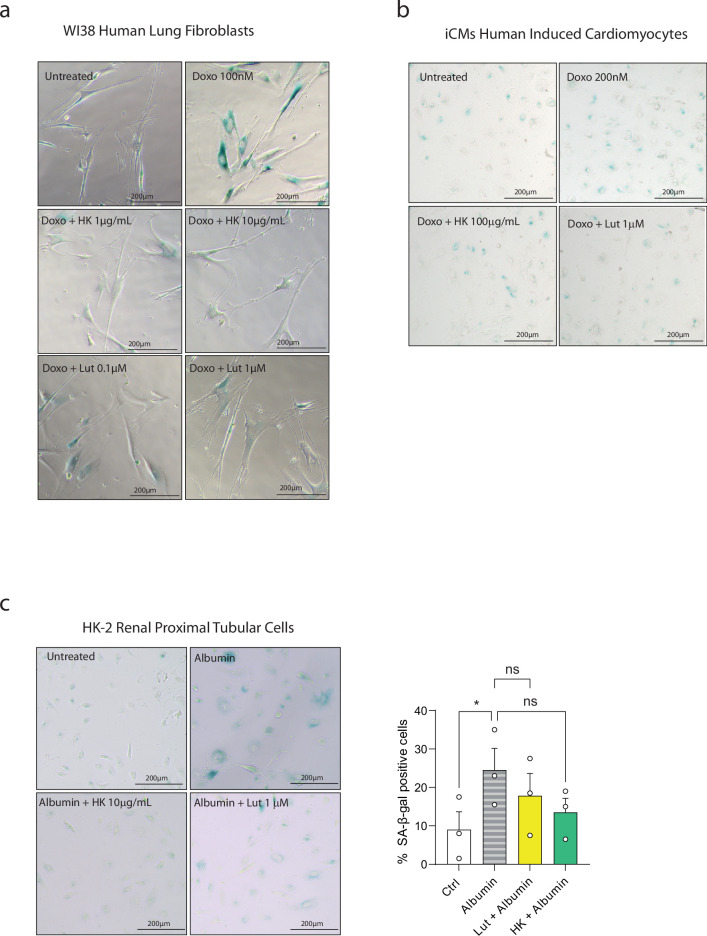
Extended Data Fig. 4. Anti-senescence effect of HK and luteolin in different cell types.
a-c, Representative SA-β-Gal photomicrographs of WI38 fibroblasts (a, n = 2 biological replicates), iCMs (b, n = 4 biological replicates). c, Representative SA-β-Gal photomicrographs of HK-2 renal proximal tubular cells (right) and their quantification (n = 3 biological replicates). Scalebar = 200 μm. Statistical test used in c: One Way ANOVA with Holm-Šídák’s test. Quantifications for a and b are shown in Fig. 5.

