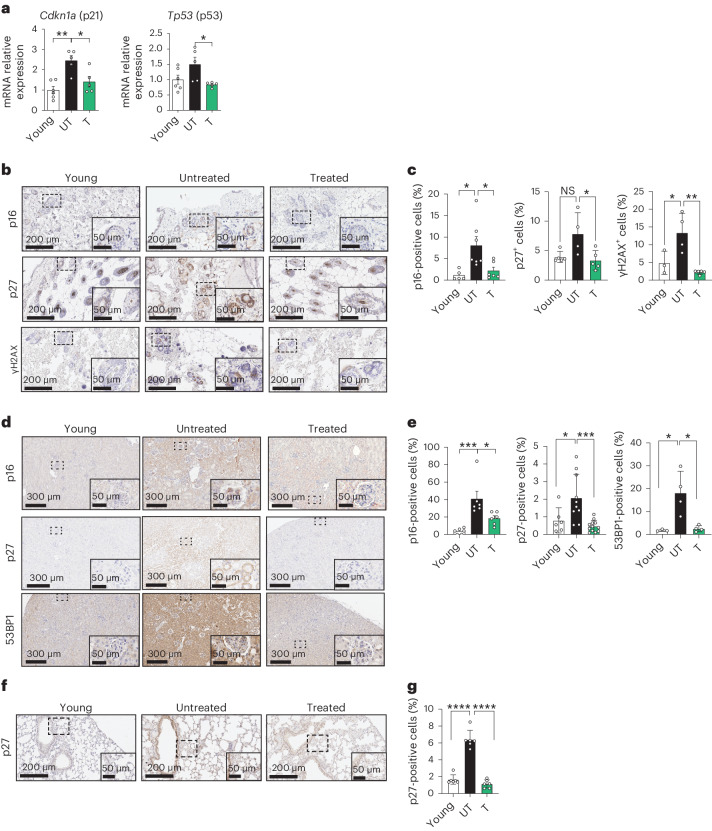
Fig. 3. HK improves senescence in mice.
a, mRNA levels of Cdkn1a and Tp53 in the gastrocnemius muscle of young (4 months old), old untreated (24 months old) and old treated (24 months old, 4 months of treatment) animals (Young n = 6, UT n = 5, T n = 5). b, Representative images of p16, p27 and γH2AX IHC analysis performed on skin sections of young (4 months old), old untreated (24 months old) and old treated animals (24 months old, treatment for 4 months). Insets show enlarged image of dashed box. c, Quantification of p16, p27 and γH2AX-positive cells in skin sections from different animals (each dot represents a different animal; p16 Young n = 5, UT n = 7, T n = 6; p27 Young n = 5, UT n = 4, T n = 5; γH2AX Young n = 3, UT n = 4, T n = 5). d, Representative images of p16, p27 and 53BP1 IHC analysis performed on kidney sections of young (4 months old), old untreated (24 months old) and old treated (24 months old, 4 months of treatment) animals. Insets show enlarged image of dashed box. e, Quantification of p16-, p27- and 53BP1-positive cells in kidney sections from different animals (each dot represents a different animal; p16 Young n = 6, UT n = 6, T n = 6; p27 Young n = 6, UT n = 10, T n = 12; 53BP1 Young n = 3, UT n = 4, T n = 4). f, Representative pictures of p27 immunohistochemistry performed on lung sections of young (4 months old), old untreated (24 months old) and old treated (24 months old, 4 months of treatment) animals. Insets show enlarged image of dashed box. g, Quantification of p27-positive cells in lung sections from different animals (each dot represents a different animal; n = 6). Data in a, c, e, g are presented as mean ± s.e.m. Statistical test used in a, c, e and g: one-way ANOVA with Tukey’s multiple comparisons test. *P < 0.05; **P < 0.01; ***P < 0.001; ****P < 0.0001; NS, nonsignificant. Exact P values found in source data files.

