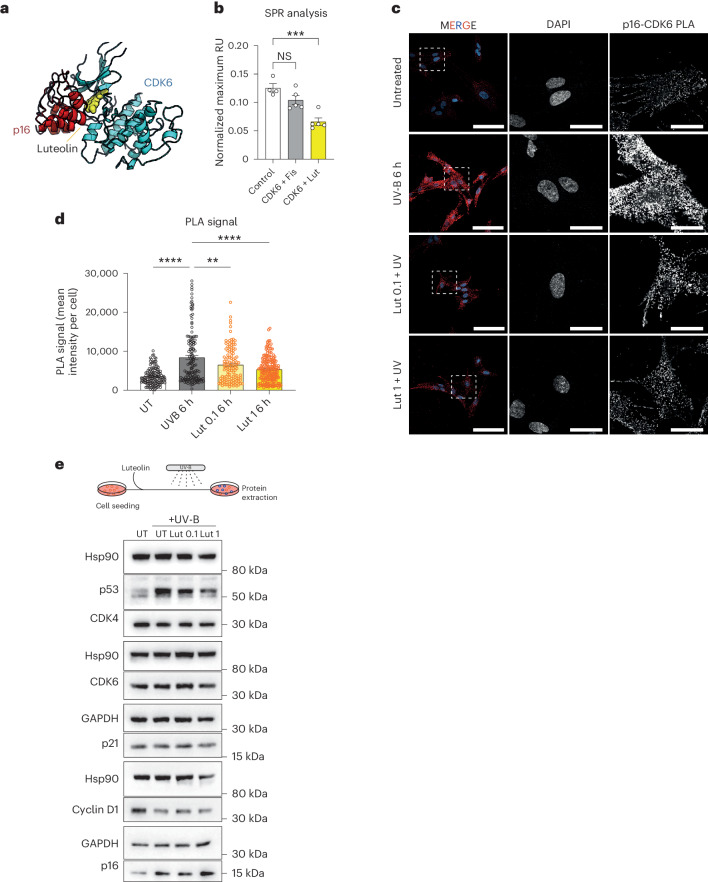
Fig. 6. Disruption of the p16–CDK6 complex by luteolin.
a, Atomistic model of the CDK6–p16 complex with luteolin obtained by the alignment of the results of docking calculations. b, SPR analysis to determine the CDK6–p16 interaction alone or with Fisetin (Fis) or Lut (Control n = 4, CDK6 + Fis n = 5, CDK6 + Lut n = 5 independent experiments). c, Representative pictures of PLA of CDK6–p16 interaction in UV-B-irradiated WI38 fibroblasts, pretreated with Lut (0.1 and 1 μM) for 1 h. Scalebars, 100 μm in merged panels, 25 μm in DAPI and p16–CDK6 PLA panels. Experiment performed twice independently with similar results. d, Quantification of PLA assay (UT n = 134, UV-B 6 h n = 142, Lut 0.1 6 h n = 122, Lut 1 6 h n = 170 cells observed over two independent experiments). e, Western blot analysis of the indicated proteins before and after UV-B irradiation of WI38 cells (n = 2 independent experiments). Data in b and d are presented as mean ± s.e.m. Statistical test performed in b: one-way ANOVA with Dunnett’s multiple comparisons test. Statistical test performed in d: one-way ANOVA with Bonferroni’s multiple comparisons test. **P < 0.01, ****P < 0.0001; NS, nonsignificant. Exact P values found in source data files.

