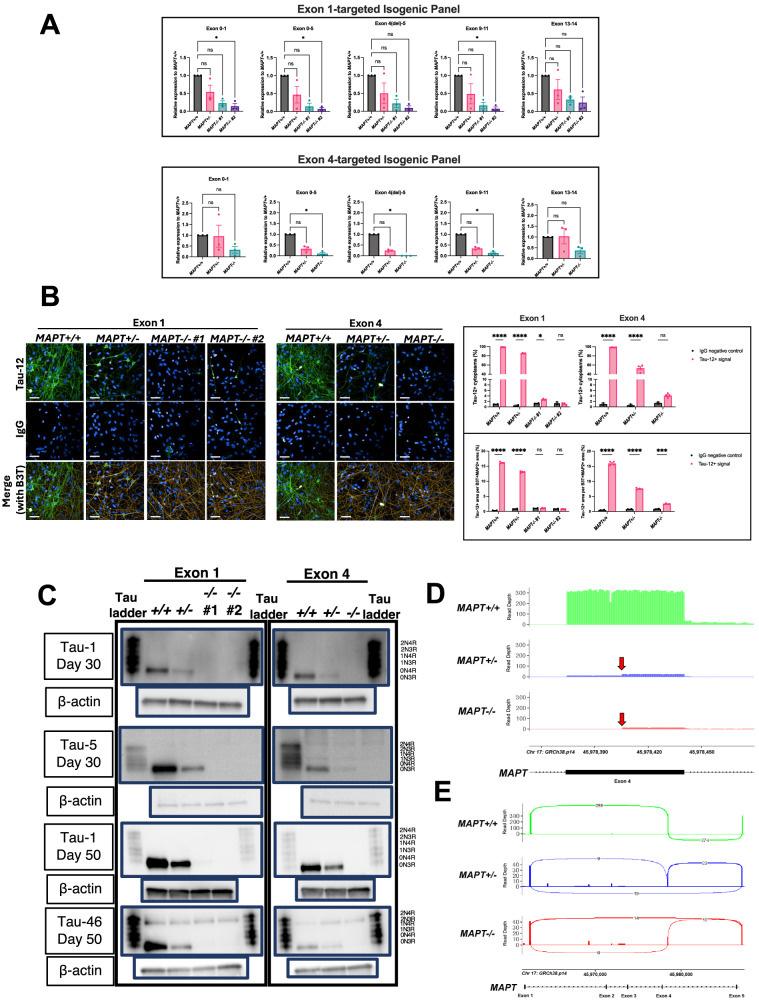
Fig. 2. Validation of MAPT−/− iPSCs.
A qRT-PCR results using cDNA samples from Day 35 NPCs of both isogenic panels. Each bar graph title indicates the primer pairs used for MAPT transcript detection. Exon 4(del) describes the the CRISPR targeted and excised locus. The data points were normalised to the respective MAPT+/+ NPCs for each differentiation. Mean ± SEM and n = three independent cortical neuron differentiation repeats. Kruskal–Wallis with Dunn’s multiple comparison test was used for statistical analysis. B ICC of Day 50 iPSC-derived cortical neurons from both isogenic panels using Tau-12 antibody targeting to probe for total tau, showing representative images (top) and quantifications (bottom). The parameters are Tau-12+ cytoplasm normalised to the total number of nuclei (top row) and Tau-12+ area relative to the total beta-3 tubulin (B3T)+ and MAP2+ areas (bottom row). Scale bar = 50 μm. Mean ± SEM. N = two wells of neurons for the IgG control and four wells of neurons for the positive Tau-12 staining from one differentiation. Two-way ANOVA with Sidak’s multiple comparison test was performed for statistical analysis. C Western blots probing for tau using three different antibodies (Tau-1 – mid-region, Tau-5 – mid-region and Tau-46 – C-terminus) either on Day 30 (NPC) or Day 50 (neuron) of neuronal differentiation for both MAPT−/− isogenic panels. 6 ng of recombinant tau ladder was used and 5 μg of lysate was added per lane (except for the Tau-46 blot where 10 μg of lysate was added). Anti-β-actin blots were used as the expression control housekeeping protein for the lysates. Full blots are shown in Supplementary Fig. 3. D Nanopore long-read sequencing of MAPT transcripts in the Exon 4 isogenic panel Day 35 NPCs. Bar graph of MAPT transcript long-read sequencing depth (normalised across genotypes) focusing on Exon 4 showing lower abundance of MAPT transcripts in the MAPT+/− and MAPT−/− lines as compared to the MAPT+/+ line. A truncated form of Exon 4 is included in a minority of reads in the MAPT+/− and MAPT−/− lines indicated by the red arrows. E Sashimi plot illustrating Exon 4 inclusion in the MAPT+/+ line and skipping in the MAPT+/− and MAPT−/− lines. Splicing patterns supported by fewer than 10% of total reads per sample were filtered for clarity.

