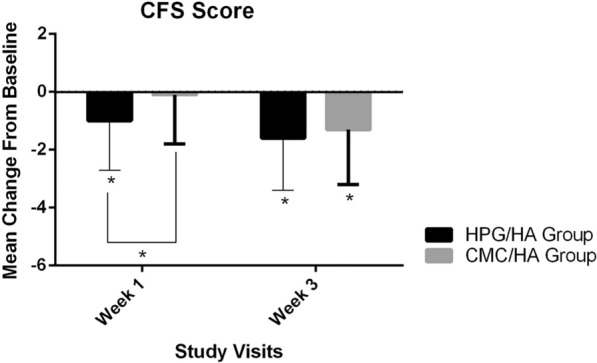
Fig. 2.

Change from baseline in CFS scores at weeks 1 and 3 (FAS population). The CFS scores (expressed as means and standard deviations) of HPG/HA group were greater than the CMC/HA group at week 1 ( – 1.0 [1.7] vs. – 0.1 [1.7], p = 0.039). At week 3, although the difference between groups was not statistically significant, the HPG/HA group had a slightly greater mean change than the CMC/HA group ( – 1.6 [1.8] vs. – 1.3 [1.9], p = 0.552). *p < 0.05. CMC carboxymethylcellulose, CFS corneal fluorescein staining, FAS full analysis set, HA hyaluronic acid, HPG hydroxypropyl guar
