Fig. 2.
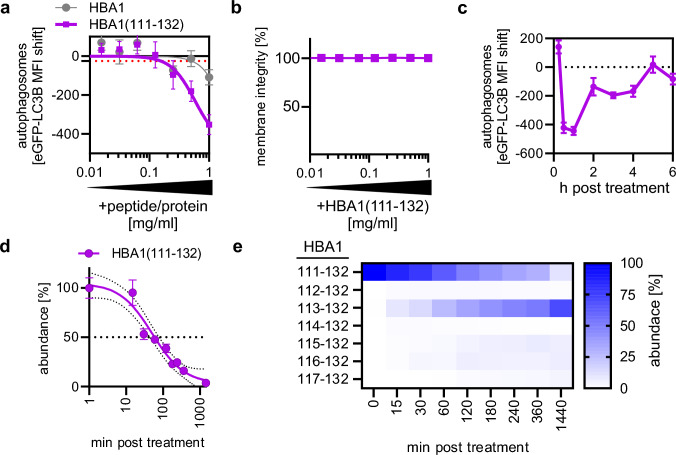
HBA1(111–132) reduces autophagic flux. a Autophagosome levels in HeLa GL cells assessed by flow cytometry 4 h post treatment with full-length HBA1 and synthesized HBA1(111–132) in a concentration range of 1 mg/ml–7.8 µg/ml. Red dotted line indicates the standard error. Dots represent mean of n = 3 ± SEM. b Membrane integrity of HeLa GL cells after treatment with varying concentrations (1 mg/ml–7.8 µg/ml) of HBA1(111–132) for 4 h, assessed by flow cytometry. Bars represent mean of n = 3 ± SEM. c Autophagosome levels in HeLa GL cells assessed by flow cytometry at indicated time points (15 min–6 h) post treatment with synthesized HBA1(111–132) at a concentration of 1 mg/ml. Dots represent mean of n = 3 ± SEM. d Abundance of synthesized HBA1(111–132) after incubation in human plasma at different time points as monitored by mass spectrometry. Small dotted lines indicate the 95% confidence interval. Big dotted line indicates 50% abundance. n = 9 (3 technical replicates of 3 biological replicates) ± SEM. e Heatmap of fragments originating from synthesized HBA1(111–132) after incubation with human plasma. Abundance % represents the intensity ratio of the respective fragment in regard to the total intensities of all fragments at this time point as assessed via mass spectrometry.

