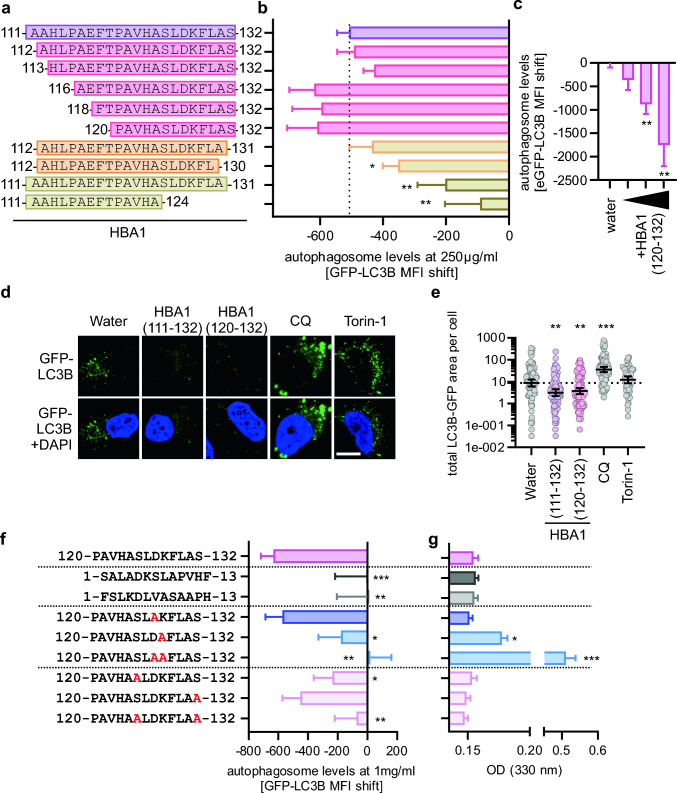
Fig. 5.
Structure activity relationship studies on HBA1(111–132). a Schematic depiction of the synthesized variants of HBA1. b Quantification of the autophagosome levels in HeLa GL via flow cytometry 4 h post treatment with indicated HBA1 fragments (a) at a concentration of 250 µg/ml. Bars represent mean of n = 6–12 ± SEM. c Analysis of autophagosomes in HeLa GL treated with HBA1(120–132) (250 µg/ml, 0.5 mg/ml, 1 mg/ml) for 4 h, assessed by flow cytometry. d Representative confocal microscopy images of GFP-LC3B (green) puncta formation in HeLa GL cells, treated for 4 h with HBA1(111–132) (1 mg/ml), HBA1(120‑132) (1 mg/ml), Chloroquine (CQ, 10 µM), Torin-1 (1 µM). Scale bar, 10 µm. DAPI (blue), nuclei. e Quantitative analysis of the LC3B-GFP area per cell of the data in (d). Lines represent geometric mean with 95% confidence interval, n = 32–110. Dotted line represents the geometric mean of the water sample. f Quantification of autophagosome levels in HeLa GL cells after 4 h of treatment with indicated version of HBA1(120–132) and co-treatment of 20 µM Chloroquine (CQ). Bars represent mean of n = 10–24 ± SEM. g Assessment of solubility of peptides indicated in (f) via optical density measurement of respective mutation of HBA1(120–132) in PBS. Student’s t-test with Welch correction. *p < 0.05; **p < 0.01; ***p < 0.001

