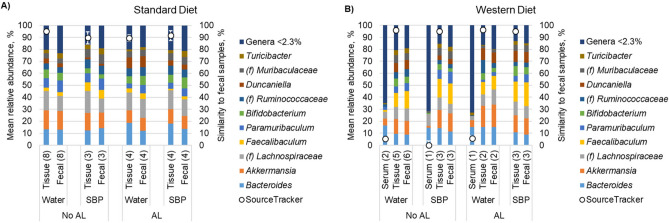
Fig. 4.
Distribution of predominant genera among matched fecal, serum, and tissue samples collected at POD7. Numbers in parentheses reflect sample sizes used for data analysis. For clarity, the top 10 predominant genera are shown and the less abundant genera were consolidated. Each genus consolidated had a mean relative abundance < 2.3% of normalized sequence reads. (f) Indicates the taxon could not be classified to greater resolution than family. SourceTracker indicates the percent of the community in tissue and serum samples that could be attributed to the fecal communities.

