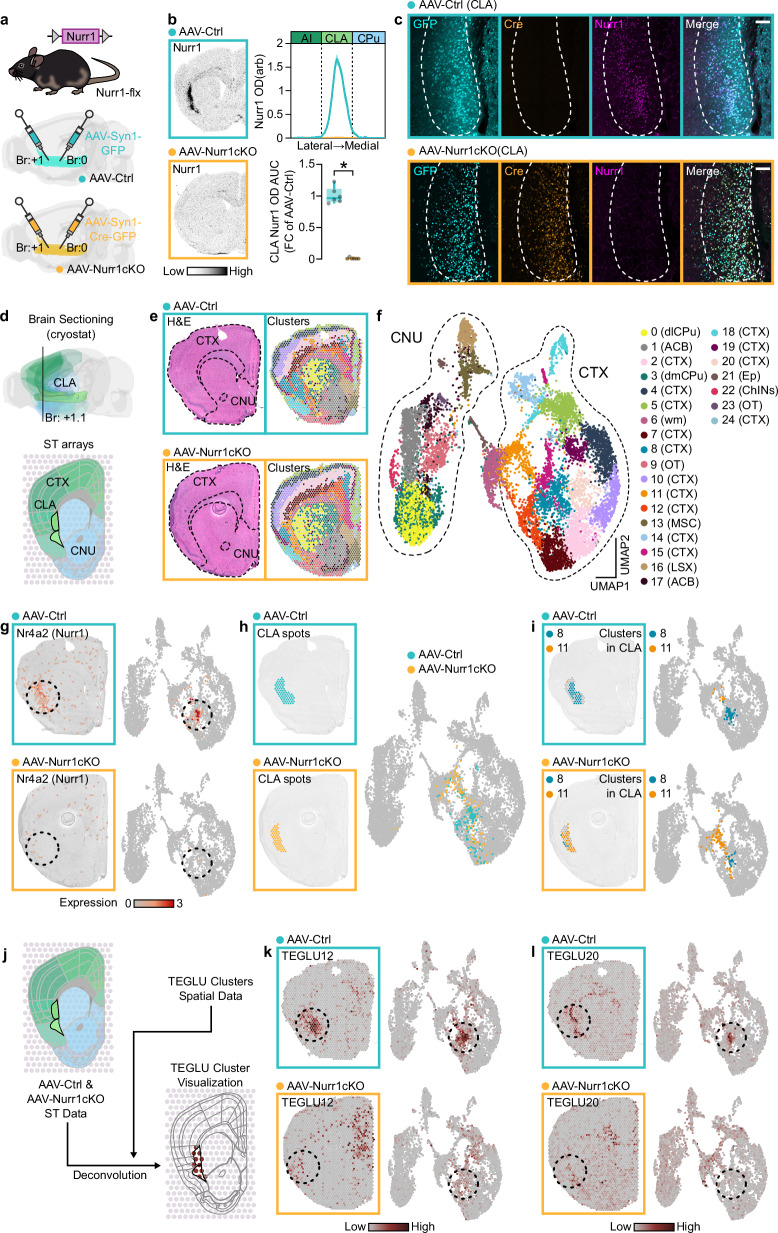
Fig. 2. Nurr1 loss changes the transcriptomic profile of the CLA.
a Illustration of Nurr1-flx mouse line construct and the viral strategy of Nurr1 deletion in CLA. b ISH autoradiographs (left) and graphs (right) showing Nurr1 mRNA at the CLAs of AAV-Ctrl and AAV-Nurr1cKO mice. (AAV-Ctrl: n = 6, AAV-Nurr1cKO: n = 6; *p < 0.0001, Two-sided Unpaired t-test). c Immunofluorescence showing GFP, Cre, and Nurr1 expression in the CLAs of AAV-Ctrl (upper) and AAV-Nurr1cKO (lower) mice (scale-bar: 200 μm). d Illustration showing the level and the brain structures of the coronal sections that were hybridized on ST arrays. e H&E-stained brain sections (left) and on-tissue visualization of the 25 molecular clusters in AAV-Ctrl and AAV-Nurr1cKO brains (AAV-Ctrl: n = 3, AAV-Nurr1cKO: n = 3). f 2D-UMAP with a categorical color code to visualize the spots’ distribution in the 25 identified molecular clusters. g On-tissue (left) and 2D-UMAP (right) visualization of Nurr1 expression in AAV-Ctrl and AAV-Nurr1cKO sections. h On-tissue (left) and 2D-UMAP (right) visualization of the spots located in the CLA region from AAV-Ctrl and AAV-Nurr1cKO sections. i On-tissue (left) and 2D-UMAP (right) visualization of clusters 8 and 11 in CLA region from AAV-Ctrl and AAV-Nurr1cKO sections. j Schematic depiction of the deconvolution analysis using the dataset from Zeisel et al. 2018. k, l On-tissue (left) and 2D-UMAP (right) visualization of TEGLU12 (k) and TEGLU20 (l) from AAV-Ctrl and AAV-Nurr1cKO sections. Data in line-graphs are expressed as mean ± SEM. Boxplots show all data points, the 25th and 75th percentile (box), the median (center), and the maxima (whiskers). The dashed circle denotes the CLA region. AAV: adeno-associated virus, ISH: in situ hybridization, GFP: green fluorescent protein, OD: optic density, arb: arbitrary units, AI: agranular insula, CLA: claustrum/dorsal endopiriform cortex complex, CP: caudoputamen, AUC: area under the curve, FC: fold change, ST: spatial transcriptomics, CTX: cerebral cortex, CNU: cerebral nuclei, H&E: hematoxylin & eosin staining, dlCP: dorsolateral caudoputamen, dmCP: dorsomedial caudoputamen, ACB: nucleus accumbens, wm: white matter, OT: olfactory tubercle, MSC: medial septal complex, LSX: lateral septal complex, Ep: ependymal cells, ChINs: striatal cholinergic interneurons, TEGLU: telencephalon excitatory projecting neurons. Source data are provided as a Source Data file.

