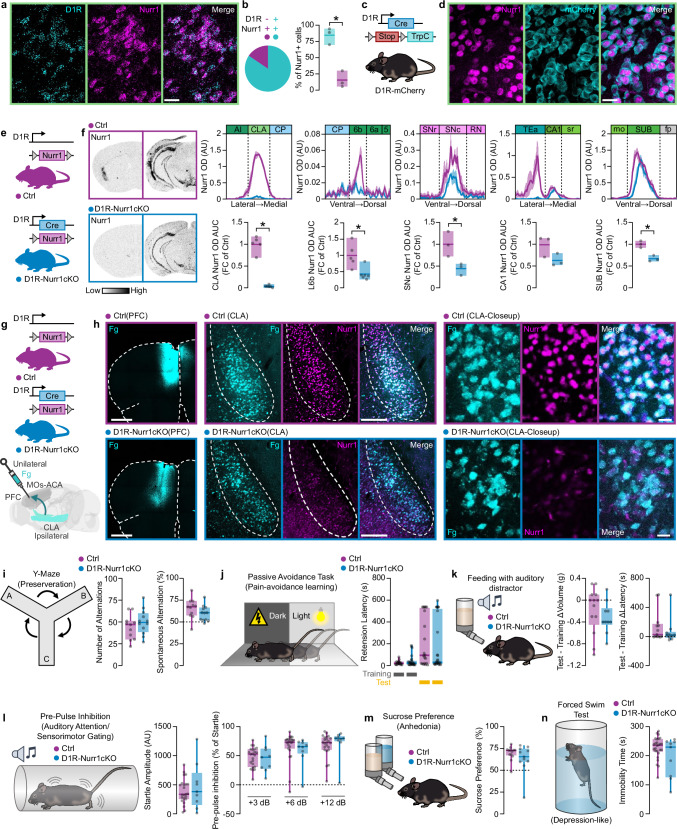
Fig. 4. Loss of Nurr1 in CLA does not affect claustrocortical projections.
a RNAscope images showing cells that co-express Nurr1 and D1R mRNA in murine CLA (scale-bar: 30 µm). b Pie-chart and bar-graph showing the percentage of Nurr1/D1R double-positive cells (*p = 0.0027, Two-sided Paired t-test). c Illustration of the D1R-mCherry mouse-line construct. d Immunofluorescent images showing Nurr1/TrpC double-positive cells in CLA (scale-bar: 30 µm). e Illustration of D1R-Nurr1cKO mouse strain construct. f Left: ISH autoradiographs showing Nurr1 mRNA at CLA and SNc level. Right: Line-graphs (upper) and bar graphs (lower) showing the Nurr1 mRNA OD quantification in CLA, L6b, SNc, CA1, and SUB (Ctrl-CLA and Ctrl-L6b: n = 5, D1R-Nurr1cKO-CLA and D1R-Nurr1cKO-L6b: n = 6, Ctrl-SNc, Ctrl-CA1, and Ctrl-SUB: n = 3, D1R-Nurr1cKO-SNc, D1R-Nurr1cKO-CA1, and D1R-Nurr1cKO-SUB: n = 3; CLA: *p < 0.0001, L6b: *p = 0.0002, SNc: *p = 0.0384, SUB: *p = 0.0055, Two-sided Unpaired t-test). g, h Illustration (g) and fluorescent images (h) showing unilateral retrograde tracing of CLA with Fg (left scale bar: 1 mm, central scale-bar: 200 µm, right scale-bar: 20 µm). i–n Illustration of behavioral task (left) and boxplots (right) showing mice’ performance at Y-maze (i) (Ctrl: n = 11, D1R-Nurr1cKO: n = 12), passive avoidance task (j) (Ctrl: n = 20, D1R-Nurr1cKO: n = 25), auditory destruction task auditory destruction task (k) (Ctrl: n = 13, D1R-Nurr1cKO: n = 10), pre-pulse inhibition task (l) (Ctrl: n = 23, D1R-Nurr1cKO: n = 9), sucrose preference task (m) (Ctrl: n = 13, D1R-Nurr1cKO: n = 11) and forced swim test (n) (Ctrl: n = 26, D1R-Nurr1cKO: n = 9). Data in line-graphs and bar graphs are expressed as mean ± SEM and mean ± minima/maxima respectively. Boxplots show all data points, the 25th and 75th percentile (box), the median (center), and the minima/maxima (whiskers). OD: optic density, arb: arbitrary units, AI: agranular insula, CLA: rodent claustrum/dorsal endopiriform cortex complex, CP: caudoputamen, AUC: area under the curve, FC: fold change, SNr: substantia nigra reticular part, SNc: substantia nigra compact part, RN: reticular nucleus, TEa: temporal association areas, sr: stratum radiatum of CA1, mo: molecular layer of dentate gyrus, SUB: subiculum, fp: posterior forceps of corpus callosum. ISH: in situ hybridization, MOs: secondary motor area, ACA: anterior cingulate area, Fg: fluorogold, rgAAV: retrograde adeno-associated virus, Tdt: tdtomato. Source data are provided as a Source Data file.

