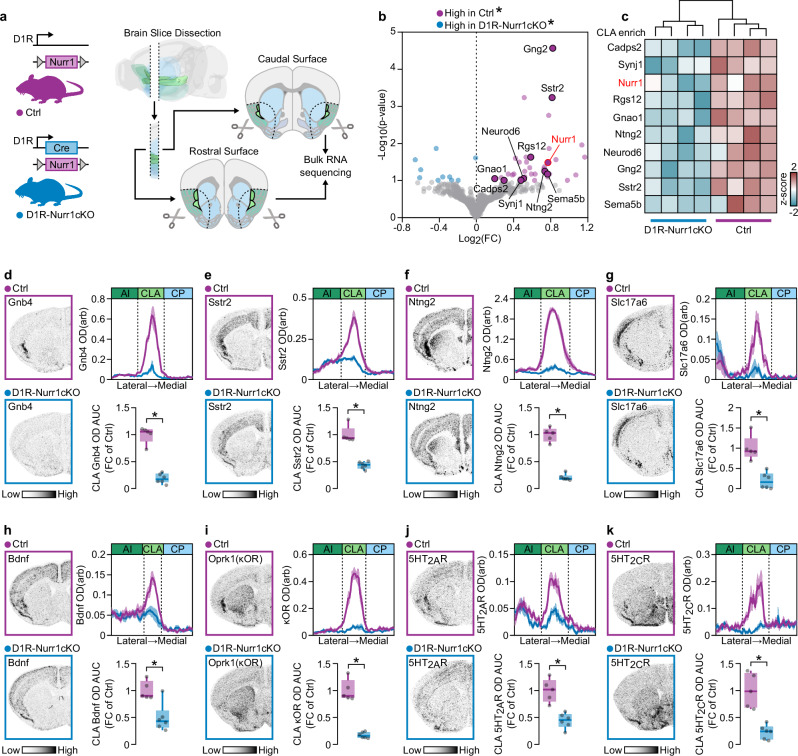
Fig. 5. D1R-Nurr1cKO mice display reduced expression of CLA-enriched genes.
a Illustration of D1R-Nurr1cKO mouse strain construct (left) and the coronal brain levels that were dissected for bulk RNA sequencing (right). b Volcano plot showing the CLA-enriched genes that were significantly downregulated in D1R-Nurr1cKO mice (Ctrl: n = 4, D1R-Nurr1cKO: n = 4; *p-value adjusted < 0.1, Benjamini & Hochberg correction). c Heatmap showing the expression z-score of the CLA-enriched genes across the different samples. d–k ISH autoradiographs (left) and graphs (right), showing Gnb4 (d), Sstr2 (e), Ntng2 (f), Slc17a6 (g), Bdnf (h), Oprk1 (κOR) (i), 5HT2AR (j) and 5HT2CR (k) mRNA at CLA of Ctrl and D1R-Nurr1cKO mice (Ctrl: n = 5, D1R-Nurr1cKO: n = 6; d: *p < 0.0001, e: *p < 0.0001, f: *p < 0.0001, g: *p = 0.0006, h: *p = 0.0046, i: *p < 0.0001, j: *p = 0.0006, k: *p = 0.0004, Two-sided Unpaired t-test). Data in line-graphs are expressed as mean ± SEM. Boxplots show all data points, the 25th and 75th percentile (box), the median (center), and the maxima (whiskers). OD: optic density, arb: arbitrary units, AI: agranular insula, CLA: claustrum/dorsal endopiriform cortex complex, CP: caudoputamen, AUC: area under the curve, FC: fold change, ISH: in situ hybridization. Source data are provided as a Source Data file.

