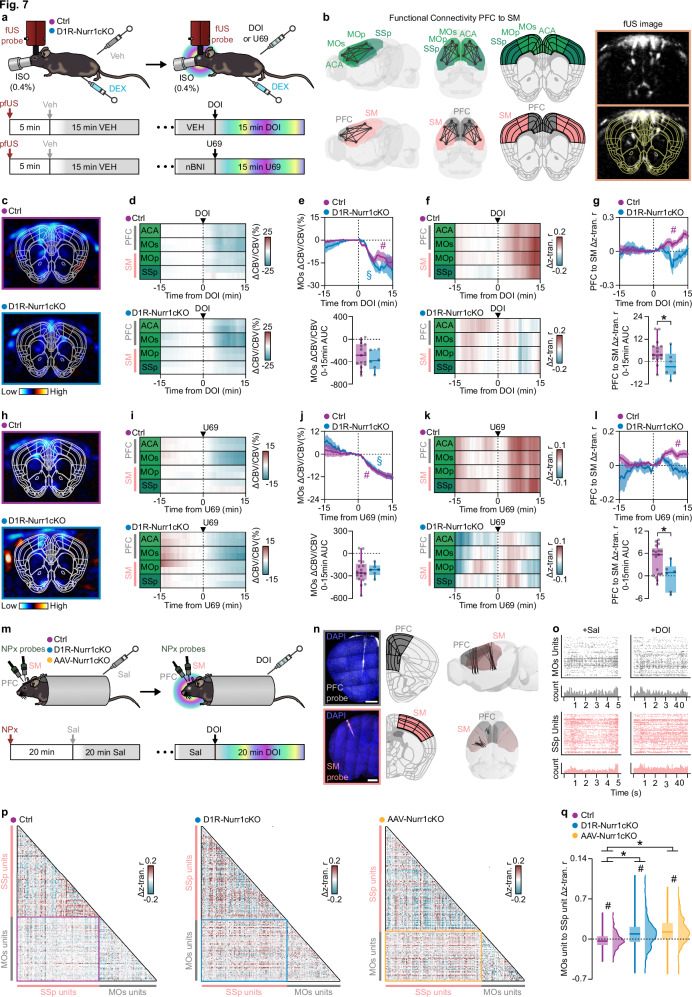
Fig. 7. Changes in cortical functional connectivity in response to hallucinogen receptor agonists are influenced by Nurr1 deletion in the CLA.
a, b Illustrations and coronal fUS image showing the experimental procedure the brain regions that were selected (PFC: gray, SM: pink). c–e pfUS images (c), heatmaps (d), and graphs (e) showing CBV changes after DOI (p = 0.4181, Two-sided Unpaired t-test). f Heatmaps showing the mean Δz-transformed-r-coefficient (correlation with the rest cortical regions) over time after DOI. g Graphs showing the Δz-transformed r-coefficient over time between PFC and SM (*p = 0.045, Two-sided Unpaired t-test). h–j pfUS images (h), heatmaps (i), and graphs (j) showing CBV changes after U69 (p = 0.7830, Two-sided Unpaired t-test). k Heatmaps showing the mean Δz-transformed r-coefficient (correlation with the rest cortical regions) change over time after U69. l Graphs showing the Δz-transformed r-coefficient change over time between PFC and SM regions (*p = 0.0282, Two-sided Unpaired t-test). m Illustration showing the neuropixel probe electrophysiological recordings. n Fluorescent images and 3d brain reconstruction showing the course of neuropixel probes in the brain (scale-bars: 1 mm). o Represenative raster plots showing the firing rate of the units after DOI. p Representative correlograms showing the Δz-transformed r-coefficient between the units of the two neuropixel probes (MOs and SSp probe). q Boxplot/violin plot graph showing the MOs to SSp unit Δz-transformed r-coefficient (Ctrl mice: n = 3, Ctrl-units: n = 281, D1R-Nurr1cKO-mice: n = 4, D1R-Nurr1cKO-units: n = 387, AAV-Nurr1cKO-mice: n = 3, AAV-Nurr1cKO-units: n = 351; #p < 0.001, Two-sided One-sample Wilcoxon signed rank test, mean = 0; Kruskal–Wallis test, p < 0.0001, *p < 0.01, Dunn’s post-hoc test). Data in line-graphs are expressed as mean ± SEM (Ctrl: DOI/U69 vs baseline: #FDR < 0.05, D1R-Nurr1cKO: DOI/U69 vs baseline: §FDR < 0.05). Animal numbers in all pfUS graphs: Ctrl: n = 15, D1R-Nurr1cKO: n = 6. Boxplots show all data points, the 25th and 75th percentile (box), the median (center), and the maxima (whiskers). pfUS: pharmacological functional ultrasound, fc: functional connectivity, DOI: 2,5-dimethoxy-4-iodoamphetamine, U69: U-69,593, ISO: isoflurane, DEX: dexmedetomidine, Veh: vehicle, SSp: primary somatosensory area, ACA: anterior cingulate area, MOs: secondary motor area, MOp: primary motor area, PFC: prefrontal cortex, SM: sensorimotor areas, CBV: cerebral blood volume, AUC: area under the curve, NPx: neuropixel, Sal: saline. Source data are provided as a Source Data file.

