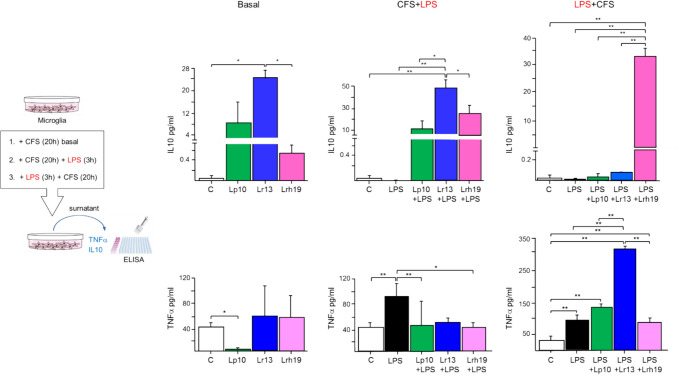
Fig. 4.
Level of secreted cytokines. The concentrations (pg/mL) of IL-10 (upper panel) and TNF-α (lower panel) were determined by ELISA in untreated microglia cells (control, white bars) and in microglia treated for 20 h with CFS from the different bacterial species (basal); in 3-h LPS-treated microglia (solid bars) and in 3-h LPS-treated microglia pre-incubated with CFS for 20 h (CFS + LPS); and in 3-h LPS-treated microglia (solid bars) and in 20-h CFS-incubated microglia following 3-h LPS stimulation (LPS + CFS). The results represent mean ± SD from three independent experiments; statistically significant differences were determined by one-way ANOVA followed by Tukey’s post hoc test. *p < 0.05; **p < 0.01. CFSs were used at 5% (v/v) concentration; LPS was used at the concentration of 1 µg/mL

